Update: Read our latest post (Feb. 2017) on SUS and PSSUQ, two usability quantification tools offered by TryMyUI
TryMyUI is now implementing the System Usability Scale, or SUS, in our user tests. Here’s a brief guide to how it works.
SUS is a user testing tool that’s become a UX industry standard for quantifying and comparing usability. A simple questionnaire comprised of 10 items rated on a 5-point scale, SUS generates a score between 1 and 100 that reflects the overall user-friendliness of your website and can be contextualized with a percentile ranking to show how your site chalks up to the rest.
Read more: Seeking Standardization in UX Feedback: The System Usability Scale
How do I get SUS on my tests?
To include the System Usability Scale in your user test, just go through the test creation process until you reach Step 3: Special Features. This is where you’ll add any quantitative metrics, including things like task usability scores, task completion ratings, and the UXCrowd.
SUS is under the first item, “Psychometrics.” Check the box to include a psychometric questionnaire, and then from the dropdown select SUS as your survey.
The System Usability Scale is only available to Team or Enterprise Plan customers.
Viewing my SUS results
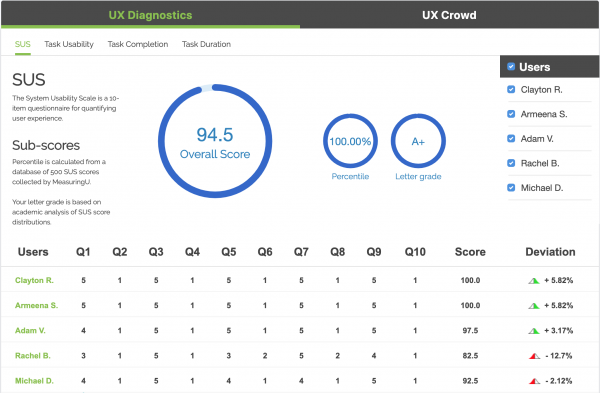
Once you get your tests back, your SUS data will be visible in the UX Diagnostics section below the user videos. You’ll see:
1. Your overall score
2. Usability & Learnability sub-scores, derived from sub-sets of the questionnaire items
3. Your percentile ranking out of a database of 500 websites
4. A letter grade based on your score
You’ll also see a table showing all the raw data: every tester’s individual responses to the 10 questionnaire items, with their personal SUS score and amount of deviation above or below the average.
In this example, the website from the test received an overall SUS score of 80.5, with a usability component of 81.88 and a learnability component of 75.00. This corresponds to roughly the 89th percentile: as indicated in the bottom-left quadrant, the site scored better than 88.91% of all other sites in the database. It receives a letter grade of B+.
These figures are based on averages of all 5 testers. You can choose which tester scores to include in your averages by unchecking names from the “Users” list at the top right. This can be useful for eliminating outliers, checking scores among different sub-sets of users (e.g., women vs men), or viewing scores from different test sprints.
Learn more about user testing surveys in general!
Keep an eye out for updates
We’ll keep you posted as we continue to add features to SUS. In the meantime, enjoy the newest addition to our arsenal of usability testing tools!


