


Have you ever asked testers a simple survey question (e.g. was the font easy to read?) and gotten a stream-of-consciousness novella in response? TryMyUI is excited to announce our latest update to combat these Joycean testers: new post-test survey question types!
Alongside our existing free-response written questions, we’ve added new multiple choice question types (single-choice as well as checkbox style multi-select) and slider rating questions.
We believe these options will help you to focus your UX research efforts and streamline your interpretation of tester responses by allowing you to more quickly evaluate key findings.
Using the new question types
These new question types can be accessed via the gear button next to each survey question textbox. From the dropdown, you will see the different types of survey questions you can ask testers:
- Free-response
- Multiple choice (select one)
- Multiple choice (select many)
- Slider rating
Multiple choice question types, unlike our standard free-response questions, allow you to define a set of possible responses for respondents to pick from.
As the name implies, the “select one” option (pictured above) will only allow testers to choose one answer option, while the “select many” (pictured below) will allow testers to check all that apply.
Slider rating questions allow you to define the response range (e.g. 1 to 5, 1 to 7, or 1 to 10) and, optionally, label the minimum and maximum values.
In the above example, we ask respondents to rate the overall usability of the website on a scale of 1-7. We also labeled each extreme as “Totally unusable” and “Extremely usable” to further clarify the rating values.
Viewing your post-test survey results
Once your test results come in, the aggregate response data is displayed in graphs alongside the individual tester responses, and can also be downloaded in an Excel spreadsheet. This allows you to visualize tester responses and quantify user trends, preferences, and opinions.
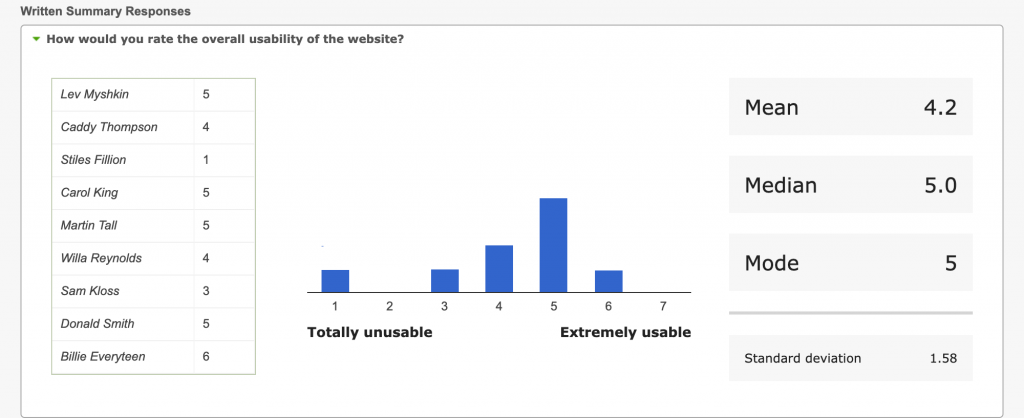
The slider ratings are displayed as a histogram showing the distribution of responses, with the mean, median, mode, and standard deviation calculated on the right. Hovering over the bars on the graph will show additional information about the number of responses.
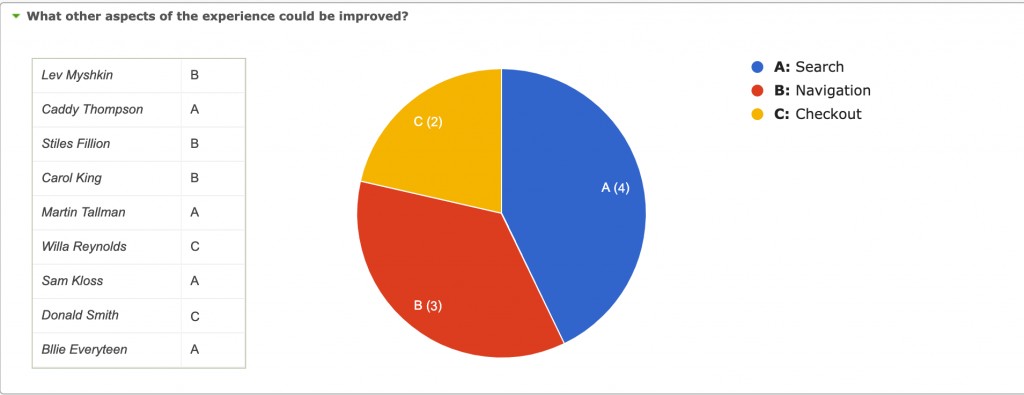
Responses for multiple choice (select one) type questions are displayed in a pie chart, showing the percentage each option received out of the total, with each options color- and letter-coded.
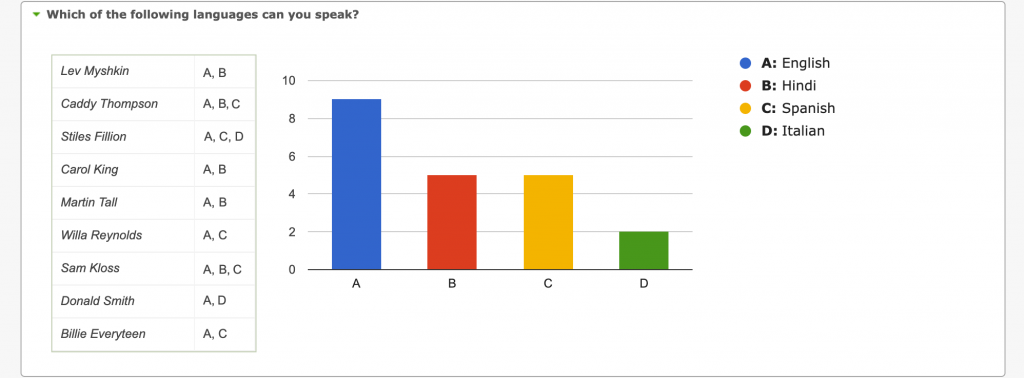
The multiple choice (select many) questions show all of the answers chosen by each tester in a table on the left, and visualize them in a color-coded bar graph. For each option, the total number of times it was selected by all testers is tallied and graphed.

Meanwhile, the free-response answers are displayed as they always have been.
Read more: How to do usability testing: A compiled guide
These new question types offer customers even more control over their tests and can make wading through responses easy to read and easy to share!
Note: this update is currently only available to Enterprise plans, with availability to Team plans scheduled for a later date.
