In a nutshell
• SUPR-Q (Standardized User Experience Percentile Rank Questionnaire) is an 8-item questionnaire that measures usability, appearance, trust/credibility, and loyalty
• NPS (Net Promoter Score) is a single question metric that measures and scores customer loyalty and impact within a range of -100 to 100
• SUPR-Q focuses on data points more generally about the experience of the user as opposed to a thorough analysis of just usability
• NPS can be enabled without the use of SUPR-Q, but the NPS metric is one of the 8 items included in the SUPR-Q feature
• Both features are available to Enterprise plans only and can be enabled during the test setup process
User-centric metrics
A good usability test will reveal flaws in your UX design, such as areas that are frustrating your users, failing to convert, or just areas that could use some general improvement. But what about the customers themselves? What are usability tests revealing about them in relationship to you, and not just your design?
Introducing our newest features to tackle the abstract nature of user research, Standardized User Experience Percentile Rank Questionnaire (SUPR-Q) and Net Promoter Score (NPS).
While gaining insights into the psychometrics of users is nothing new with our platform, implementing the SUPR-Q and/or NPS allows for the additional measurements of trust/credibility, appearance, and loyalty.
Read on to learn how they work, how can you use them, and how they will appear on our platform.

The superpowers of SUPR-Q
SUPR-Q is a powerful 8-item questionnaire designed by Jeff Sauro of MeasuringU. It differentiates itself from other similar tools with quarterly updates to its vast index of tested websites and its four-factor analysis (usability, appearance, trust/credibility, and because it includes NPS by default, loyalty).
Here are some key things to note about using it:
It predicts your SUS score
Sauro, a veteran of the UX industry, wanted the SUPR-Q to correlate with pre-existing industry standards, such as the SUS. To that end, he designed the SUPR-Q’s 2-item usability factor to predict the SUS score, ensuring a solid usability score, with the added psychometrics of appearance, loyalty, and trust.
Read more: What is the System Usability Scale (SUS)?
It’s tested, reliable, and valid
With data from 4,000 responses across three studies, Sauro and co. refined the SUPR-Q to create both a valid and reliable tool while also indexing 150 of the web’s top sites. Hint: 50 is average, so don’t worry too much if you think you got an “F” grade.
The SUPR-Q also boasts high internal-consistency, ensuring that the questionnaire is a reliable metric across a variety of contexts.
When it comes to validity, SUPR-Q rocks three key types of validity research
- Content validity, which examines the elements of a site’s UX via expert judgement
- Convergent validity, comparing the SUPR-Q with the SUS and other questionnaires that measure similar aspects of UX
- Discriminate validity, differentiating and weighing excellent and poor websites for baseline analysis
It’s the perfect compliment to usability tests
Like most questionnaires, SUPR-Q is about measuring the experience of a user, not telling you what to fix on your website. For that, to echo Sauro himself, you still need to conduct a thorough usability test, which is why we are so excited to include it as an optional feature in our platform.
Read more: What is usability testing?
How to read the results

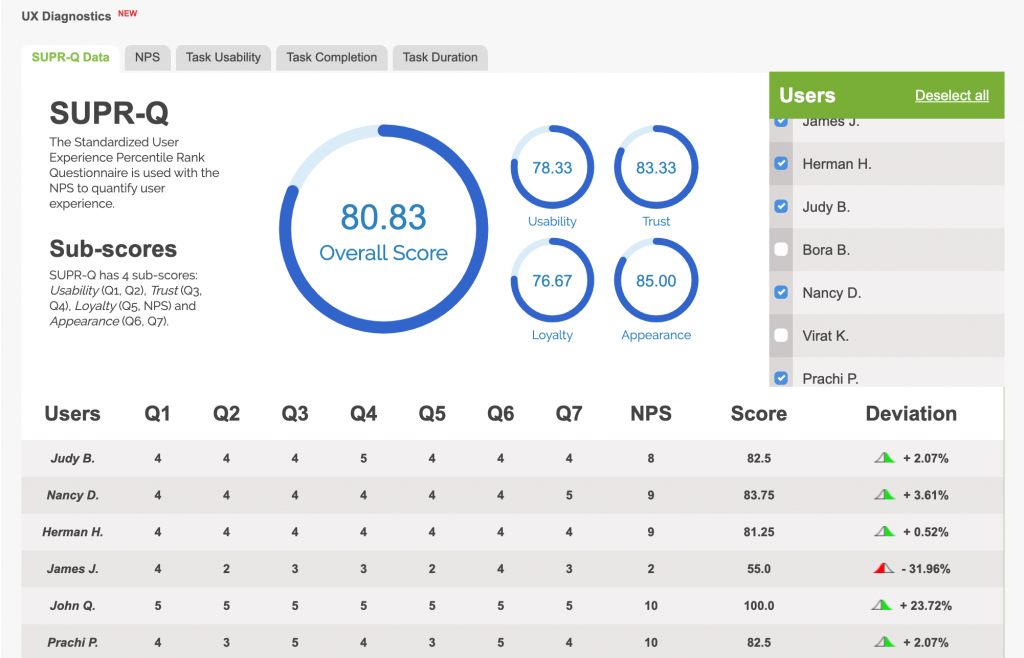
The SUPR-Q results can be found in our newly updated UX Diagnostics panel and is displayed in five circles:
- Overall Score: an average score of the four sub-scores
- Usability: calculated from questions 1 and 2
- Trust: calculated from questions 3 and 4
- Loyalty: calculated from question 5 and the built-in NPS question
- Appearance: calculated from questions 6 and 7
Like with all of our user testing metrics, the scores can be changed via checking and unchecking users to the right of the panel.
When to use it:
Ultimately, you are trading off a more precise data set in usability for a broader understanding of the user’s experience and relationship to your design, from the GUI to the interaction.
While the SUS is a great metric for understanding how usable your design is, the SUPR-Q offers a more sophisticated peek into the mind of users.
Compared to the PSSUQ, and despite having half the amount of questions, there is only a modest reduction in reliability of numbers. But, like with the SUS comparison, SUPR-Q increases intangible data points that PSSUQ fails to capture.
Read more: SUS vs PSSUQ

Measuring loyalty with NPS
The Net Promoter Score, or NPS, is an index score calculated by the responses to a single question: how likely is it that you would recommend our company/product/service to a friend or colleague? The users respond to that question on a scale of 0-10, 0 being not at all likely, and 10 being very likely.
But there’s a little more to it than just that.
Within the 0-10 response range are three distinct categories that users are sorted into: Promoters, Passives, and Detractors. The dispersion of users into these categories will inform your score.

Scoring
Your NPS is determined by subtracting the percentage of customers who are Detractors from the percentage who are Promoters. For example, if every respondent is a Detractor, this will lead to an NPS of -100. But if only half the respondents are Detractors and the other half are Promoters, you will net a 0.
Note: Passives are not added or subtracted at any point in the equation.

NPS Results
The results of the NPS, if enabled, are viewable in the second tab of the UX Diagnostics panel. The users are sorted into three columns, which display the percentage of each type of user based on their response.
Promoters
Promoters respond with either a 9 or a 10. This indicates that they love your products and/or services. They are most likely repeat customers who also recommend your company to other potential buyers via word-of-mouth.
Passives
Passives respond with a 7 or 8. Although they are mostly satisfied with your company, they are in danger of being lost to a competitor. While they may not be likely to disparage your company to other potential buyers, they also will not encourage other buyers to use your products or services.
Detractors
Detractors respond with a 6 or lower. These respondents are not pleased with your product or services and probably will not solicit your business again. Even more impactful is that they are likely to dissuade other potential buyers from using your services or products.
Learn more: user testing better products and user testing new products

Getting the user’s view with NPS and SUPR-Q
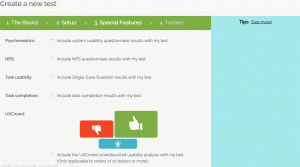
To begin testing with the NPS and SUPR-Q, navigate to the Special Features tab in your create new test setup. When checking the Psychometrics box, you will see the list of available questionnaire models, including SUPR-Q.
You will notice two types of SUPR-Q are available: SUPR-Q E-commerce and SUPR-Q Non-commerce. Choose which of the two is more relevant to your company. The difference will be a small tweak in how some questions are worded.
Next, NPS is clearly marked as a stand-alone checkbox after Psychometrics. Note again that because NPS is included in the SUPR-Q model, it will already be checked after selecting SUPR-Q.
We typically recommend that e-commerce usability studies enable NPS.

Neither the NPS nor SUPR-Q are end-all, be-all solutions for your UX research or design. They, like most tools in your UX research arsenal, shine light into very specific dark corners.
Read more: A compiled guide to usability testing
That said, the added information from the SUPR-Q and NPS provides valuable insights into the intangible nature of the user. A solid usability test coupled with these tools will give you the most complete picture of your UX research and your user’s experience.
Note: the SUPR-Q and NPS features are currently only available for our Enterprise customers


