


User experience (UX) is crucial to a product’s success. Whether it’s a software application, a website, or a physical device, usability is key in ensuring that users can interact with the system effectively and efficiently. One of the most widely recognized tools for evaluating usability is the System Usability Scale (SUS).
Developed by John Brooke in 1986, SUS offers a quick, reliable, and cost-effective method for assessing perceived usability across various systems.
The scale consists of a 10-item questionnaire with a five-point Likert scale ranging from “Strongly Disagree” to “Strongly Agree.” SUS is versatile and applicable to various systems, including software, websites, mobile apps, and physical devices.
This blog will explore the intricacies of SUS, including its components, advantages, disadvantages, and best practices for using it effectively in 2024.
What is the System Usability Scale (SUS)?
The System Usability Scale (SUS) is a widely recognized tool for assessing the usability of a system, product, or service.
The SUS questionnaire covers a broad spectrum of usability aspects, such as ease of use, consistency, and user confidence. It includes positive and negative statements, like “I think that I would like to use this system frequently” and “I found the system unnecessarily complex.” This alternating phrasing helps minimize response bias, ensuring a more balanced evaluation of the overall user experience.
Scoring the SUS involves converting the responses into a numerical scale from 0 to 100. The score is calculated by subtracting one from the score for each odd-numbered question and subtracting each even-numbered question’s score from five.
These adjusted scores are then summed and multiplied by 2.5, resulting in a single usability metric. Typically, a score above 68 indicates above-average usability, though the interpretation may vary based on the context and specific requirements of the system being evaluated.
Components of SUS
The System Usability Scale (SUS) comprises several key components that comprehensively measure a system’s usability. These components include:
1. Questionnaire Structure
The SUS consists of a 10-item questionnaire with each item scored on a five-point Likert scale, ranging from “Strongly Disagree” to “Strongly Agree.” The items alternate between positive and negative statements, helping to reduce response biases and covering a wide range of usability aspects.
2. Usability Aspects Covered
The questions are designed to assess various dimensions of usability, such as ease of use, learnability, efficiency, and satisfaction. They include items that gauge whether users find the system cumbersome or straightforward, whether they feel confident using it, and whether they believe they would need support to use it.
3. Scoring Methodology
Scoring the SUS involves a specific formula. For odd-numbered questions (which are positively worded), the score contribution is the scale position minus 1. For even-numbered questions (which are negatively worded), the contribution is 5 minus the scale position. These scores are then summed and multiplied by 2.5 to convert the total to a range of 0-100. This final score reflects the overall usability of the system.
4. Interpretation of Scores
The resulting SUS score provides an overall measure of usability. Generally, a score above 68 is considered average, with higher scores indicating better usability. However, the interpretation of scores can vary depending on the specific context and user expectations. The SUS score can also be further analyzed to provide insights into specific areas of strength or improvements that need to be made within the system.
Advantages and Disadvantages of System Usability Scale (SUS)
The System Usability Scale (SUS) is a widely used tool for evaluating the usability of a system, product, or service. Here’s a breakdown of its advantages and disadvantages:
Advantages of the System Usability Scale (SUS)
- Simplicity and Efficiency:
The SUS is straightforward and quick to administer, typically taking only a few minutes for users to complete. This efficiency makes it an excellent tool for gathering usability data without imposing significant time burdens on participants or researchers. - Versatility:
SUS can be used across various systems and products, including software, websites, mobile apps, and physical devices. Its broad applicability makes it a go-to tool for many industries and contexts. - Reliable and Valid Results:
Despite its brevity, the SUS has produced reliable and valid results. The consistent structure and specific scoring methodology contribute to its reliability as a measure of perceived usability, making it a trusted metric in UX research. - Benchmarking and Comparisons:
The SUS allows for easy comparison of usability across different systems or versions of a product. Since it is widely used, a wealth of benchmark data is available, enabling organizations to gauge where their product stands relative to industry standards or competitors.
Disadvantages of the System Usability Scale (SUS):
- Limited Depth of Insights:
While SUS provides a good overall measure of usability, it needs to delve deeper into specific usability issues or user behaviors. It identifies whether there is a problem but doesn’t specify what the problem is or how to fix it. - Interpretation of Scores:
Interpreting SUS scores can sometimes be challenging, especially without additional context. While scores above 68 are generally considered good, the meaning of a specific score can vary depending on the industry, user expectations, and the system’s complexity. - Potential for Misinterpretation:
While helpful in preventing response bias, the questions’ alternating positive and negative phrasing can sometimes confuse respondents. Misinterpretations of the questions can affect the accuracy of the responses and the overall score. - Non-Contextual Nature:
The SUS provides a numerical score that does not inherently account for the context of use. For example, a high SUS score might not entirely reflect the usability challenges faced by users with specific disabilities or in particular usage scenarios. This lack of context can limit the applicability of SUS results to particular user groups or environments.
Despite these disadvantages, the SUS remains a popular and valuable tool in usability testing, particularly for its ease of use and ability to provide quick, actionable insights.
Best Practices for Using the System Usability Scale
Using the System Usability Scale (SUS) effectively involves establishing methodologies and adapting to current trends and technologies. Here are some best practices for leveraging SUS in modern usability testing:
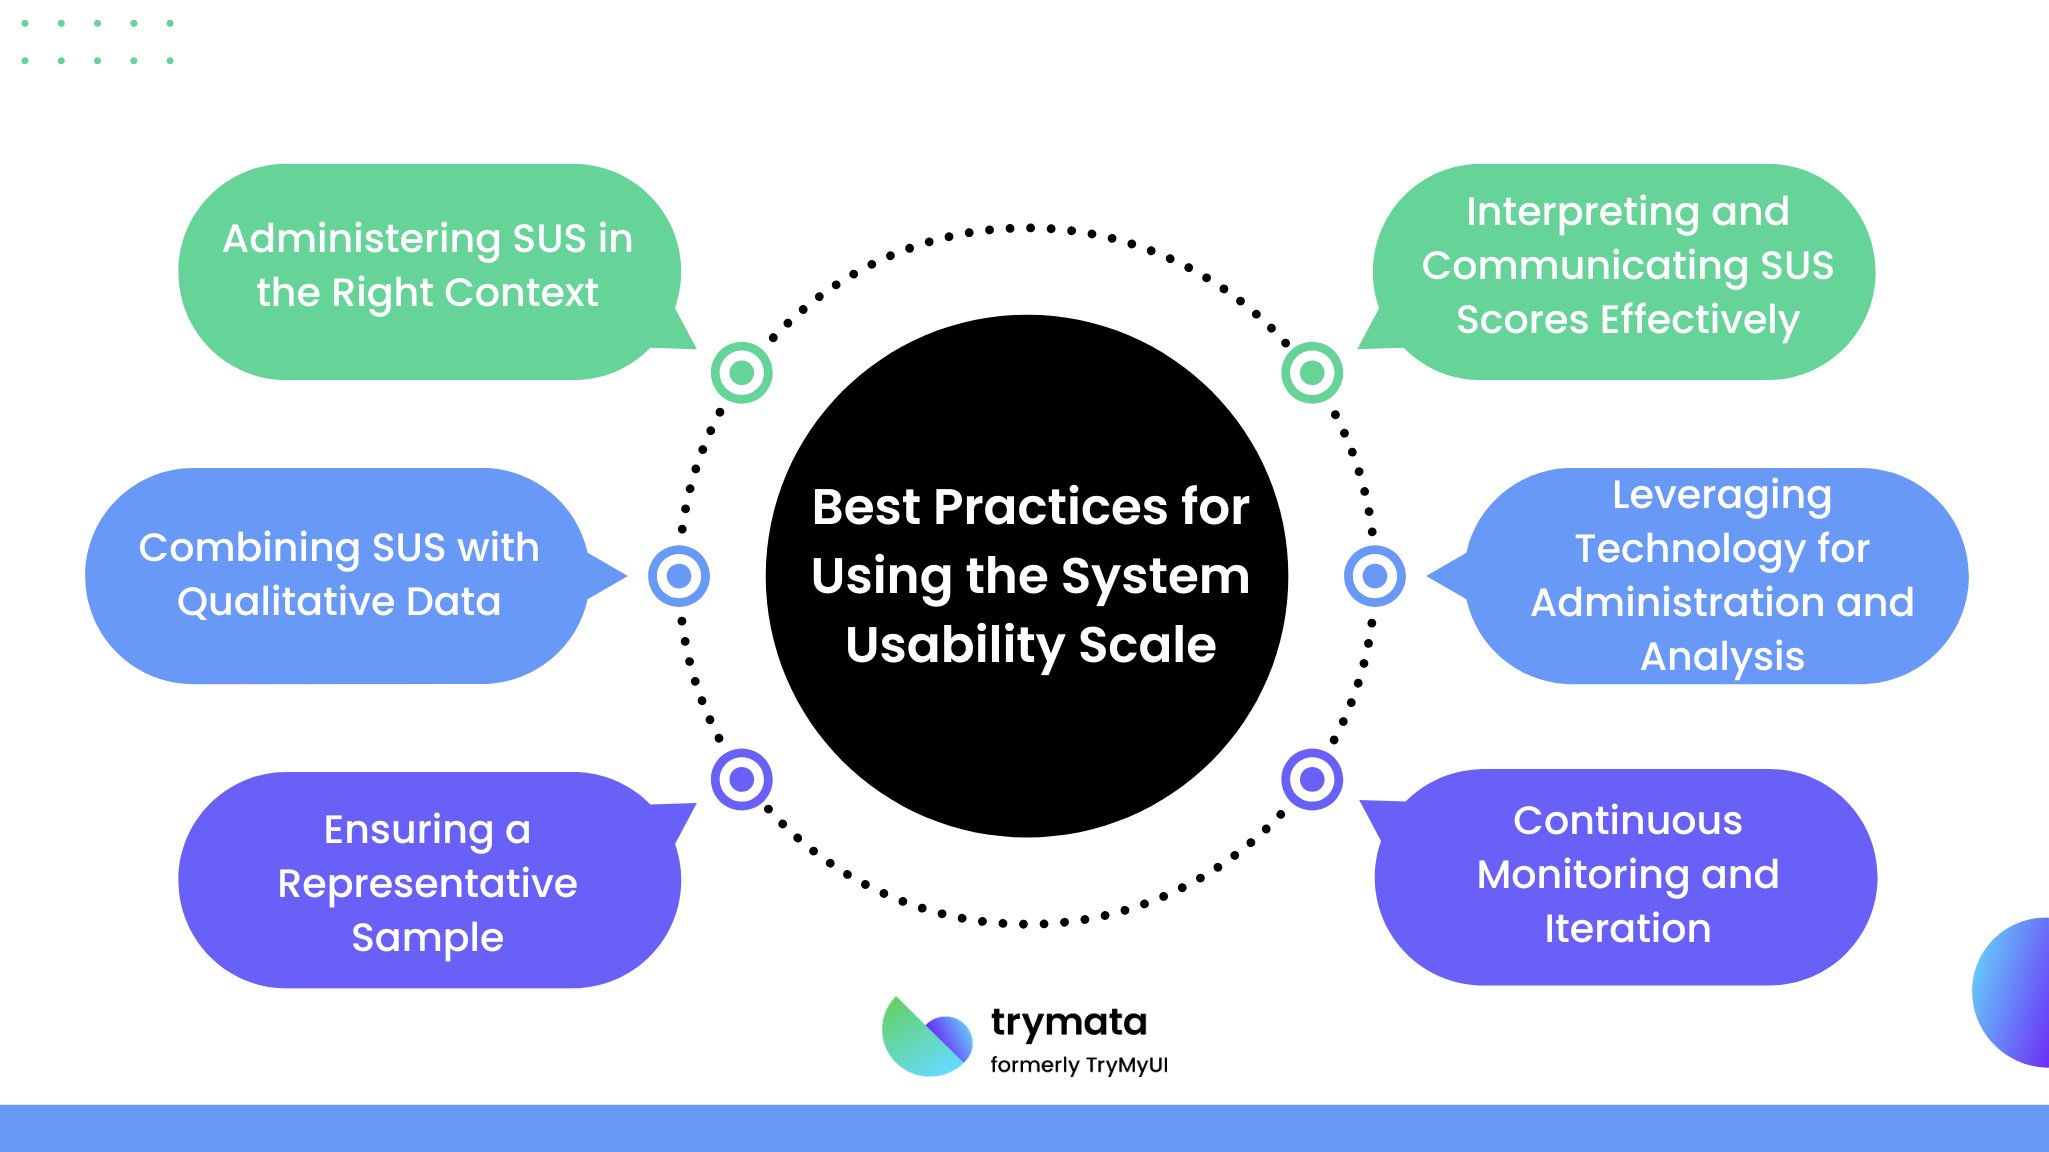
1. Administering SUS in the Right Context
To maximize its value, SUS must be used in the right context. It is best applied when a quick, general assessment of a system’s usability is needed. Ensure that the system being evaluated has reached a stage where users can interact with it meaningfully, such as during the final stages of development or after significant updates.
2. Combining SUS with Qualitative Data
While SUS provides valuable quantitative insights, complementing it with qualitative data can provide a fuller picture of usability issues. Use SUS as a starting point, then follow up with interviews, open-ended questions, or user observations to delve deeper into specific issues raised by the SUS scores. This mixed-methods approach helps identify the “why” behind the scores and provides actionable insights.
3. Ensuring a Representative Sample
For the SUS results to be meaningful, it’s crucial to survey a diverse and representative sample of users. This means considering different user demographics, experience levels, and contexts of use.
In 2024, consider including users with varying levels of digital literacy and those using assistive technologies, as these groups can highlight different usability challenges.
4. Interpreting and Communicating SUS Scores Effectively
SUS scores should be interpreted in the context of industry benchmarks, user expectations, and the system’s specific goals. In 2024, advanced analytics tools will be utilized to analyze and visualize SUS data.
Use benchmarks and historical data to provide context for the scores. Communicate these findings to stakeholders, emphasizing that while SUS provides a useful overview, it is one part of a comprehensive usability evaluation.
5. Leveraging Technology for Administration and Analysis
In 2024, leverage digital tools and platforms to administer the SUS questionnaire, collect responses, and analyze results. Online survey tools can streamline the process and ensure data accuracy. Data analytics platforms can also help quickly aggregate and analyze responses, allowing for real-time usability insights.
6. Continuous Monitoring and Iteration
Usability is an ongoing concern, and SUS should be used as part of a continuous improvement process. Regularly conduct SUS assessments, particularly after major updates or releases, to track changes in usability over time. This practice helps identify trends, measure the impact of design changes, and ensure that the system remains user-friendly.
By using these best practices, you can effectively utilize the System Usability Scale in 2024 to gather meaningful insights into user experiences, identify areas for improvement, and ultimately enhance the usability of your systems and products.
Calculating the SUS Score
To calculate the SUS (System Usability Scale) score, follow these steps:
1. Collect Responses:
- The SUS questionnaire consists of 10 items.
- Each item is rated on a five-point Likert scale from 1 (“Strongly Disagree”) to 5 (“Strongly Agree”).
2. Adjust Scores:
- For odd-numbered questions (1, 3, 5, 7, 9): Subtract 1 from the user’s response.
- For even-numbered questions (2, 4, 6, 8, 10): Subtract the user’s response from 5.
3. Sum the Adjusted Scores:
- Add all the adjusted scores together.
4. Multiply by 2.5:
- Multiply the sum by 2.5 to obtain the SUS score.
5. Interpret the Score:
- The final score will be a number between 0 and 100.
- A SUS score above 68 is generally considered above average.
Example Calculation:
Let’s say a user gives the following ratings:
- 4 (Odd)
- 2 (Even)
- 3 (Odd)
- 4 (Even)
- 5 (Odd)
- 3 (Even)
- 4 (Odd)
- 2 (Even)
- 4 (Odd)
- 3 (Even)
Step 1: Adjust the scores.
- Odd items: 3, 2, 4, 3, 3
- Even items: 3, 1, 2, 3, 2
Step 2: Sum the adjusted scores.
3+2+4+3+3+3+1+2+3+2=263 + 2 + 4 + 3 + 3 + 3 + 1 + 2 + 3 + 2 = 263+2+4+3+3+3+1+2+3+2=26
Step 3: Multiply by 2.5.
26×2.5=6526 \times 2.5 = 6526×2.5=65
So, the SUS score is 65, which indicates usability is slightly below average.
Conclusion
The System Usability Scale (SUS) remains a foundational tool in usability testing due to its simplicity, versatility, and effectiveness in providing quick insights into user experience. Developed over thirty years ago, SUS offers valuable user feedback on a system’s usability across various products and platforms.
You can understand how users interact with your system by utilizing the SUS effectively in 2024—administering it in the proper context, combining it with qualitative data, ensuring a representative sample, and leveraging modern technology.
While SUS provides a useful overview of usability, it’s important to complement it with other evaluation methods to address specific issues and gather in-depth insights. Regularly applying SUS and interpreting its results within the context of industry benchmarks and user expectations will help you make informed decisions and drive continuous improvements.