Usability testing fills a critical need in understanding users’ responses to your website’s UX, but the inherent subjectiveness of the video/audio feedback format means that it can be difficult to distill meaning from a large number of responses. Your testers are writing you a novel with their words – the plot is no secret, but what’s their underlying theme?
Fortunately, a tool already exists to consolidate and synthesize individual testers’ responses into a coherent synopsis of a site’s strengths and inadequacies – one that is widely respected and is something of an industry standard in usability research.
The System Usability Scale (SUS) has long been a favorite among researchers for its simplicity and accuracy: 10 questions, a 5-point “strongly agree” to “strongly disagree” response system, and a quick scoring algorithm yield an extremely reliable usability score on a scale of 0 to 100.

The ten items of the SUS questionnaire are:
- I think that I would like to use this system frequently.
- I found the system unnecessarily complex.
- I thought the system was easy to use.
- I think that I would need the support of a technical person to be able to use this system.
- I found the various functions in this system were well integrated.
- I thought there was too much inconsistency in this system.
- I would imagine that most people would learn to use this system very quickly.
- I found the system very cumbersome to use.
- I felt very confident using the system.
- I needed to learn a lot of things before I could get going with this system.
Read more: The System Usability Scale (SUS)
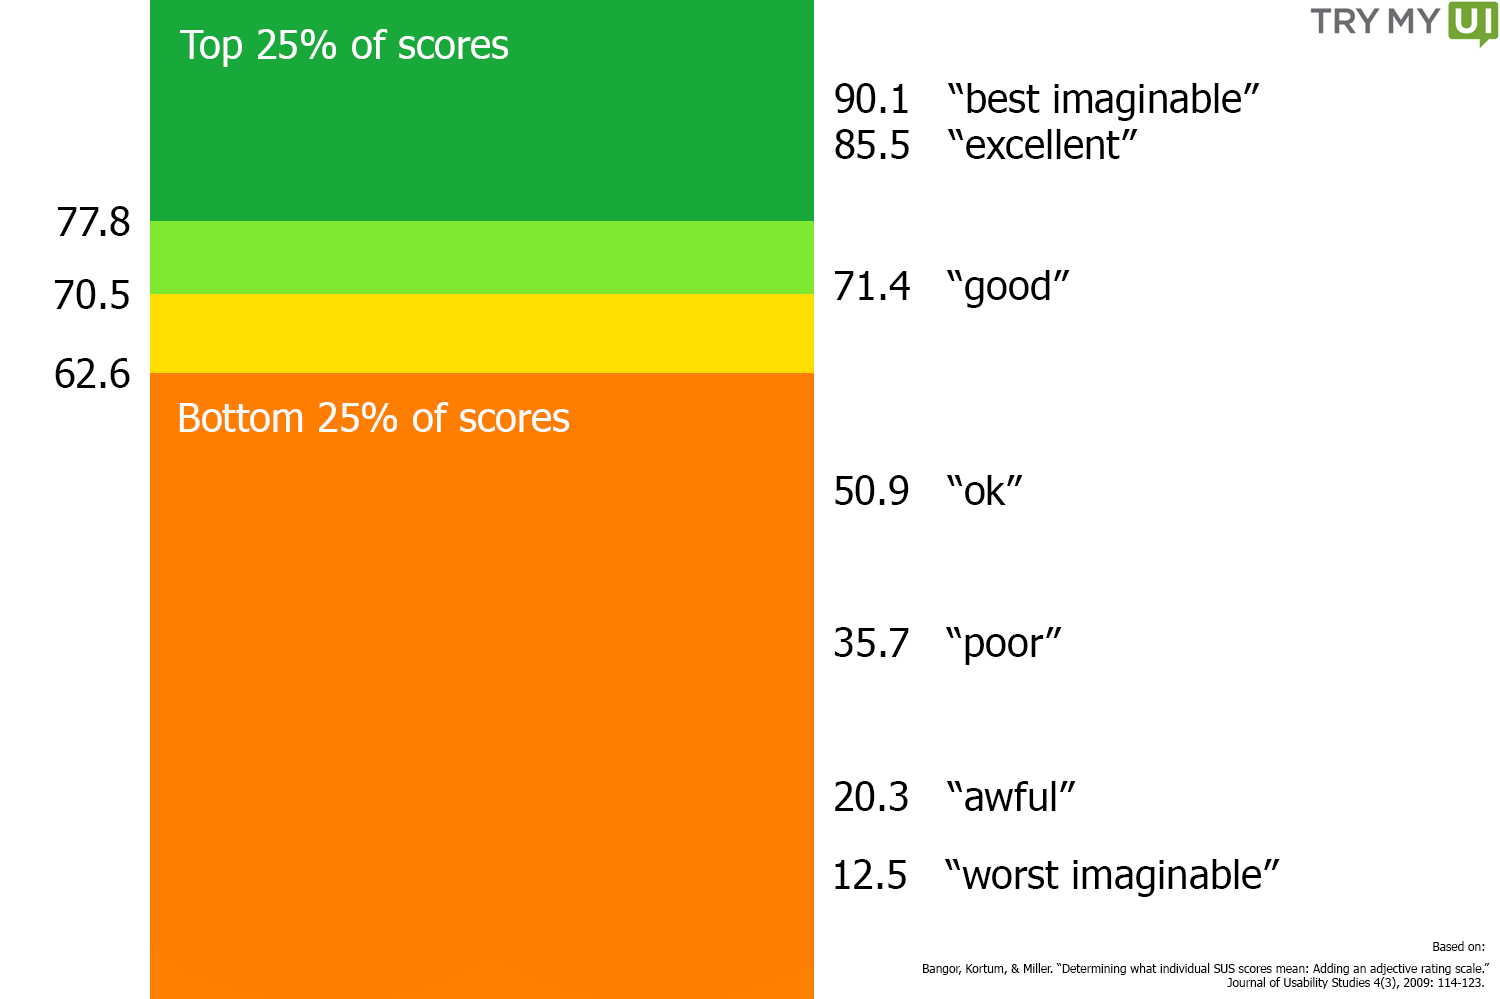
SUS gives you a solid indication of users’ overall satisfaction with your website, and can even be broken down into usability and learnability dimensions. Our percentile ranking contextualizes your raw score, allowing you to understand how your site performs relative to hundreds of others; and some researchers have attempted, with some success, to map adjectives like “excellent,” “poor,” or “worst imaginable” onto specific raw scores for extra insight.

By various accounts, the mean SUS score hovers around 68-70.5 (a score that roughly corresponds, as it happens, to the adjective “good,” though falling rather short of “excellent”). Normalizing score distribution with percentiles therefore makes a 68 (or a 70.5) into a 50% – better than half of all other systems tested, and worse than the other half.
Though described by its inventor as a “quick and dirty” measure, studies have found SUS to be among the most accurate and reliable of all usability surveys, across sample sizes. It has today become one of the most successful metrics for quantifying system satisfaction, with thousands using it to gauge user-friendliness over a wide range of products online and off.
It is these qualities that make SUS the key to normalizing a diverse array of tester feedback, and aggregating responses into a meaningful but concise picture of your UX. If individual test videos are the trees, SUS shows you not only the forest, but the entire ecosystem into which your system fits; it describes your site not as a standalone entity, but as a part of the wider web world that surrounds and thus helps to define it.
With a widely-trusted industry standard to rely on, you can take a step back from your own company and see how you chalk up in the bigger picture.
Read more: SUS and PSSUQ: Comparing usability quantification tools
TryMyUI is happy to announce that we have added SUS to our arsenal of usability testing tools to keep you on the forefront of web usability. To learn more about the System Usability Scale and its application in UX research, join TryMyUI and Measuring Usability’s Jeff Sauro for the SUS Webinar on October 9.


