The usability testing dilemma
You’re facing a dilemma. Doing usability research is vital to creating a product that’s data-driven and user-centric, but usability testing is time-consuming and doesn’t scale easily.
On the one hand, most of your usability issues can be uncovered with no more than 10 testers. But even that many tests, if each one is 20 minutes, makes for 200 minutes of video to slog through, some of which will be irrelevant and unuseful.
The other problem is that often your stakeholders want to see numbers. Quantitative data has a unique quality of convincing, that has the capacity to strengthen and back up qualitative findings. But 5 tests don’t make for valid statistics, and if you benchmark yourself against the numbers from 5 tests, it’s much harder to set predictable objectives for each sprint.
More: Qualitative vs quantitative in UX research
And so the dilemma: Do you run more tests to get reliable numbers but more video than you can watch? Or do you stay small, comb through your results finely, but never get a good handle on your product’s performance?
The multiple uses of quantitative data
The key is to read between the lines of your usability testing data. Video may not scale well, but if you know how to use your quantitative data, it’s a lot easier to handle, and can be dissected quite efficiently – even on a large scale.
Information like TASK DURATION, for example, is more than just a statistic to show higher-ups, or a benchmark for the next sprint. Which task took the longest to complete? Was it longer than you expected? Look for users whose times stand out from the rest – an unusually long task duration could indicate a user who struggled with the task.
With just this observation you now have a starting point in tackling your video data: rather than randomly picking one of your 10 user videos and watching it beginning to end, you pick the user that struggled, and skip to the task they had trouble with.
As you start combining other forms of data you can compile your shortlist of video clips to watch.
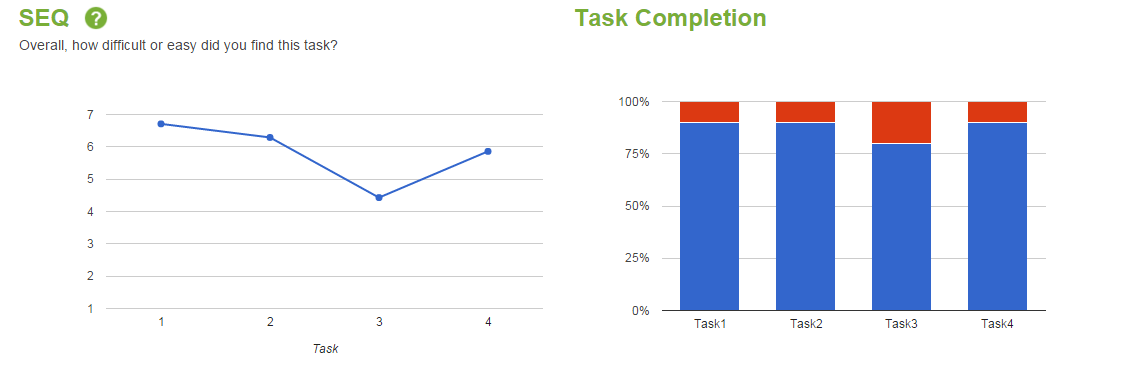
 TASK COMPLETION rates and TASK USABILITY measures like the Single Ease Question (SEQ) help identify the most difficult portions of the experience, and which users found certain tasks difficult or even impossible to finish.
SYSTEM USABILITY scores like SUS or PSSUQ indicate which users had the worst (and best) overall experience on the site. If you’re going to watch any videos all the way through, these ones are a good choice to give you the best return on your time.
UXCROWD, a crowdsourced usability tool, uses voting to show what users liked and disliked about the site. These results can help you identify which parts of the test videos to focus on; you can also compare UXCrowd responses to WRITTEN SURVEY responses to see what else users had to say about those issues.
After doing this bit of preparation, you’ll have a pared-down but highly targeted list of video clips to watch, that may look something like this:
- Users with the best and worst experiences
- Hardest 1-2 tasks from the users with the worst task ratings
- Tasks with unusually long durations from some users
- Tasks containing issues found in UXCrowd
- Users with interesting feedback in the written survey
After working through this much of your data, you can use what you’ve seen so far to make decisions about any additional videos to watch.
Usability testing can be done at scale, and in a time-efficient manner; the key is to use all the available data to inform your analysis strategy and take advantage of smarter usability testing tools to get the most return on your time.
Right now, you can use the promo code TEAM20 here to supercharge your usability testing strategy, with 100% more tests each month and the best tools TryMyUI has to offer. Start testing smarter today!
Learn more: user testing better products and user testing new products


