How do you quantify the experience of users on your website or app? Beyond psychometrics like SUS, PSSUQ, ALFQ, or the SUPR-Q, the experience of a user boils down not to afterthoughts via post-test surveys, but to a series of interactions that usability testing hopes to predict and guide in realtime. All websites and app depend on interactions with their users, and in usability testing, task-based testing is the most accurate method of simulating or predicting these interactions via a well-written task script.
Measuring the success of these individual tasks will measure the success of some, if not all, aspects of your product’s user experience. Each written task, which will cumulatively reflect the overall experience of the user, is also a unique opportunity to learn where designs can be improved. How does Trymata empower designers and researchers to take advantage of task-based usability testing?
Measuring task completion
Task Completion on Trymata’s user testing platform is a simple “yes/no” prompt that testers will respond to after attempting to complete the task and before moving on to the next. This feature is enabled during the create a new test flow and is optional for every task that you write.
Task Completion a crucial and obvious metric for immediately determining the usability of a certain flow, which could be interrupting the success of even the best designed aspect of a website or app. Remember that websites and apps have precious little time to make an impression on a user. A single hiccup, especially for new users, could result in a bounce or uninstall.
Measuring task difficulty: The single ease question
The Single Ease Question (SEQ) uses a Likert Scale response system, not unlike many psychometrics. However, as its name implies, SEQ is just one question: “How difficult or easy did you find the task?” rated between 1-7. Like the Task Completion prompt, the SEQ is a tightly focused, nonintrusive method that does not pile significant amounts of time, effort, or complexity onto the tester (or the researcher) and happens in realtime.
The SEQ is optional and can be enabled for all tasks in your script, just like the Task Completion prompt. Testers will use a slider bar to rate each task that the SEQ is enabled on before continuing to the next task.
Did you know some user testing services don’t even offer these basic quantitative data offerings? While others charge a premium blanket price?
Register for our FREE trial that includes all the things our competitors refuse to!

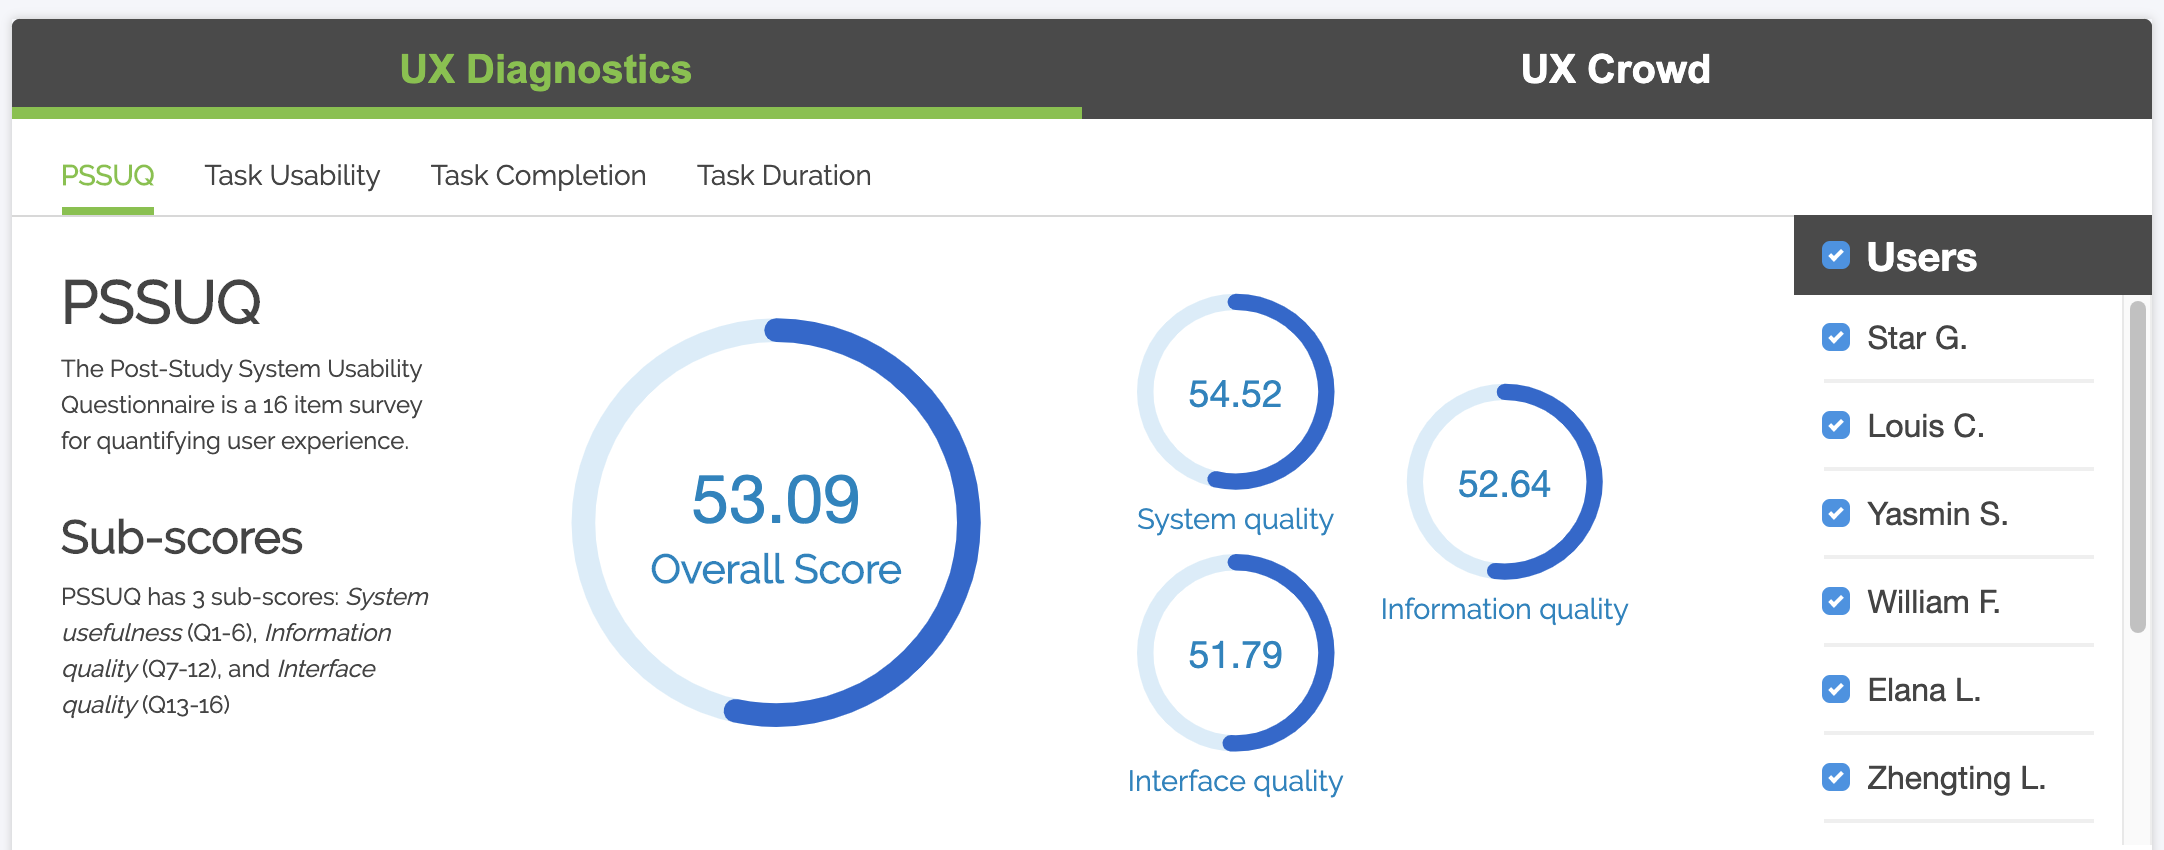
Measuring task success: UX diagnostics
The beauty of usability testing is that you can watch and hear the user reasoning their actions and their frustrations, providing researchers the unique glimpse into the minds of their targeted demographics. A task that could not be completed is indicative of a likely failure in design, and researchers may not realize it until they see, hear, and confirm that the interaction is flawed via video recording and the Task Completion and/or SEQ features.
But how the data is presented is also crucial.
Trymata’s UX Diagnostics is the one-stop dashboard for all the quantitative measurements you choose to enable. First, the SEQ is displayed via a line graph measuring each user’s marked level of difficulty as well as the average. Each user is a unique color, as is the average, and each line can be selected or deselected. This enables researchers to quickly compare, isolate, or disregard any number of users.
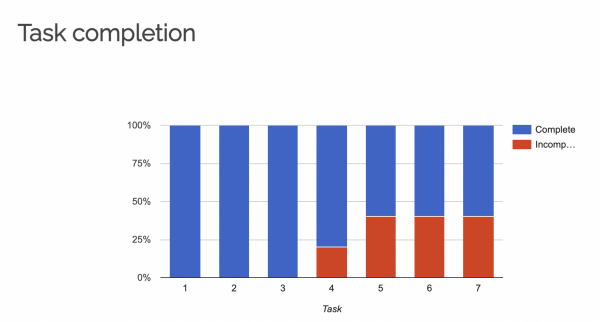
The Task Completion tab is a simple, clear stacked bar-graph measuring each task’s level of completion, and importantly, displays the user(s) who marked the task as “could not could not complete” and even provides a shortcut timestamp to launch their user video immediately so researchers can quickly get to the bottom of what went wrong.

Trymata is all about saving the researcher’s time. With UX Diagnostics specifically, you can easily see the journey of each tester, task by task, as well as the average experience overall. This is a great way to hone in on the most interesting data points before you ever even watch a video!
Register for our FREE trial that includes 5 user testing videos with full features!


