


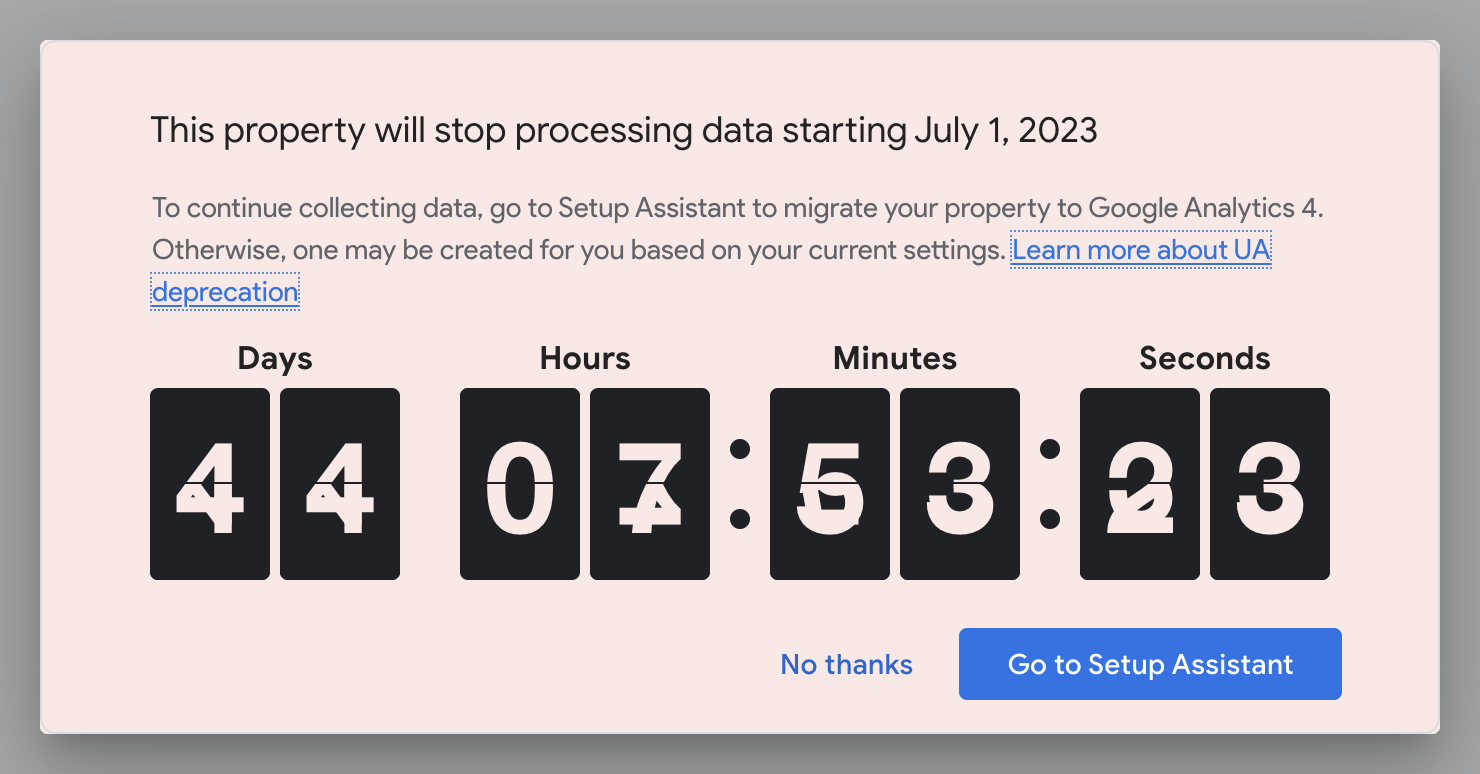
If you use Google Analytics at all, then you’ve no doubt seen the big red warning messages recently when you log in. They proclaim, ominously:
This property will stop processing data starting on July 1, 2023. To continue measuring website performance, complete setup for your connected Google Analytics 4 (GA4) property as soon as possible.
We’ve been seeing it for a while now. But our team has also been slowly learning more about GA4, which we were forced to start using when setting up our new Trymata.com web property last year.
So far, we’ve had to deal with data that’s no longer available, data that’s harder to find, features that have been eliminated, and general difficulty of usage on the new platform.
In this article, we’ll discuss our experience of the changes between GA3 (aka “Universal Analytics” or “UA”) and GA4. This is not a comprehensive list of everything that’s different – nor is it an expert manual of everything you need to know to use GA4 like a pro.
Rather, it’s a look at how our team, with an intermediate level of Google Analytics knowledge and experience, has found the transition to be – and if you yourself aren’t a Google Analytics expert, an idea of how the transition to GA4 might go for you, too.

An overview of reactions to GA4 so far
Before we get into the nitty-gritty details, here’s a brief look at what people have been saying about the new Google Analytics version. To put it bluntly, the reception has not been good.
Many professionals in the web analytics, CRO, and market research field have decried it as “awful,” horrible,” “unusable,” and worse – check out this article full of expert responses.
One of our favorite descriptions that sums up the new version is from this tweet by Gill Andrews:
I’ve never seen a tool upgrade that made simple things sooo complicated 🤦 Non-tech business owners were already struggling to use it. But now they have NO chance.
Unfortunately, we’ve found all these sentiments to be pretty much spot-on. In the next section, we’ll describe some of the major differences we’ve encountered that have made Google Analytics harder to rely on.
Biggest differences between GA3 and GA4
From our experience, the biggest differences between Google Analytics 4 and Universal Analytics fall into 2 categories: (1) fewer default datasets, and (2) less functionality for interacting with each dataset.
Fewer default datasets
Right off the bat, this is the most noticeable difference when starting to use Google Analytics 4. Compare the primary side menus of GA3 (left) and GA4 (right):
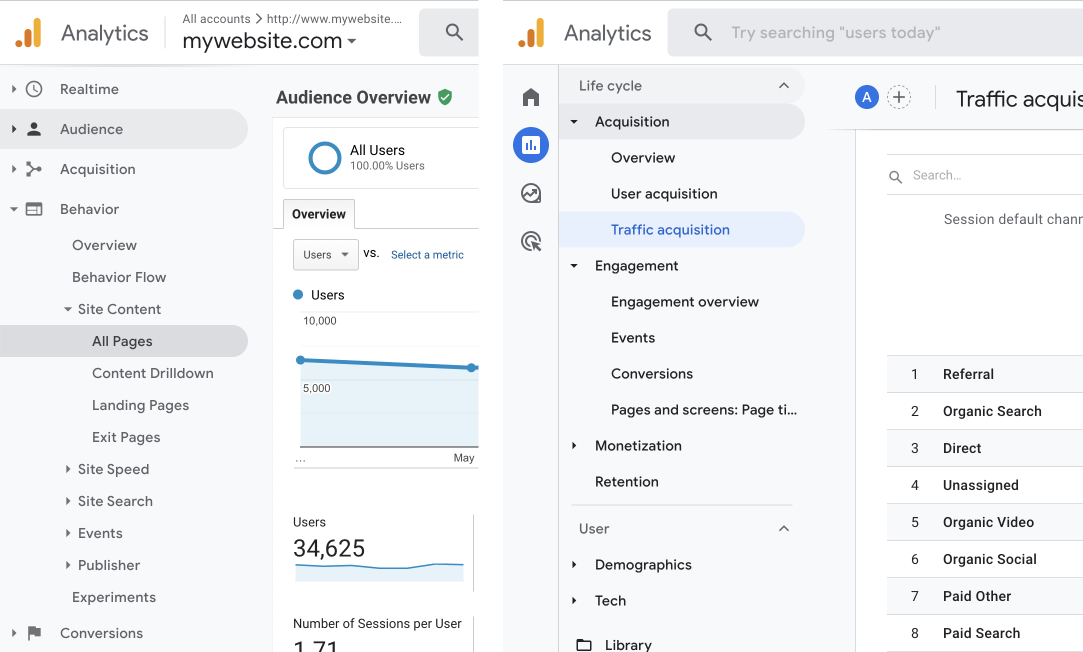
Just for reference, we counted them for you: GA3 has a total of 107 default pages/views available via the side menu, while GA4 has just 26.
Of course, GA3’s massive menu can feel overwhelming, and it isn’t easy to figure out. However, it’s also well-organized into main categories and subcategories – and for many of us, all we need to know is how to get to the few specific datasets that we’re tracking, and most items (even whole menu categories) can be ignored. Once you’ve figured out where the data you care about is, you can beeline to those pages in the side menu and get what you need quickly.
With GA4, though, there’s a good chance that the datasets you were checking for your weekly/monthly KPIs now no longer have a page of their own.
Example
Imagine, for example, you’ve been tracking the performance of all your top landing pages. GA3 has a default view for all landing page data, accessible via Behavior > Site Content > Landing Pages. Here, you can see a table listing all pages on your website based on number of entrances, and check related data points like the average session duration for users who entered through each page, or the percentage that were new users.
In GA4, there’s no default view for landing pages. In the main view for all site content, you can add a column that shows number of entrances for each page. But even then, the table is still not designed for the express purpose of evaluating entry points, so a lot more customization needs to be done in order to get to a data view that really lets you understand your landing pages’ performance at the same level that GA3 gave you immediately, with no extra work.
The same is true for a huge number of other datasets. Most things that used to have a default view of their own on GA3 simply don’t on GA4.
Related read: Trymata, the best alternative for Google Analytics
Less functionality for interacting with data
Besides the major decrease in readily available datasets, the tables and views that are still present in Google Analytics 4 have heavily reduced functionality.
Advanced search
One of the most glaring is the “Advanced search” feature on tables in GA3. In a large dataset, you could apply an advanced search if you wanted to quickly exclude large swaths of the data and just see certain subsets. This functionality allowed you to narrow your data down by criteria of all kinds, and apply a multitude of them all at once.
Tables in GA4 no longer have any kind of advanced search built in. You can only do a simple search, which does not allow any kind of special search terms either (so if you want to see everything matching 2 different groups of pages at once for example, you can’t do a search with both terms together).
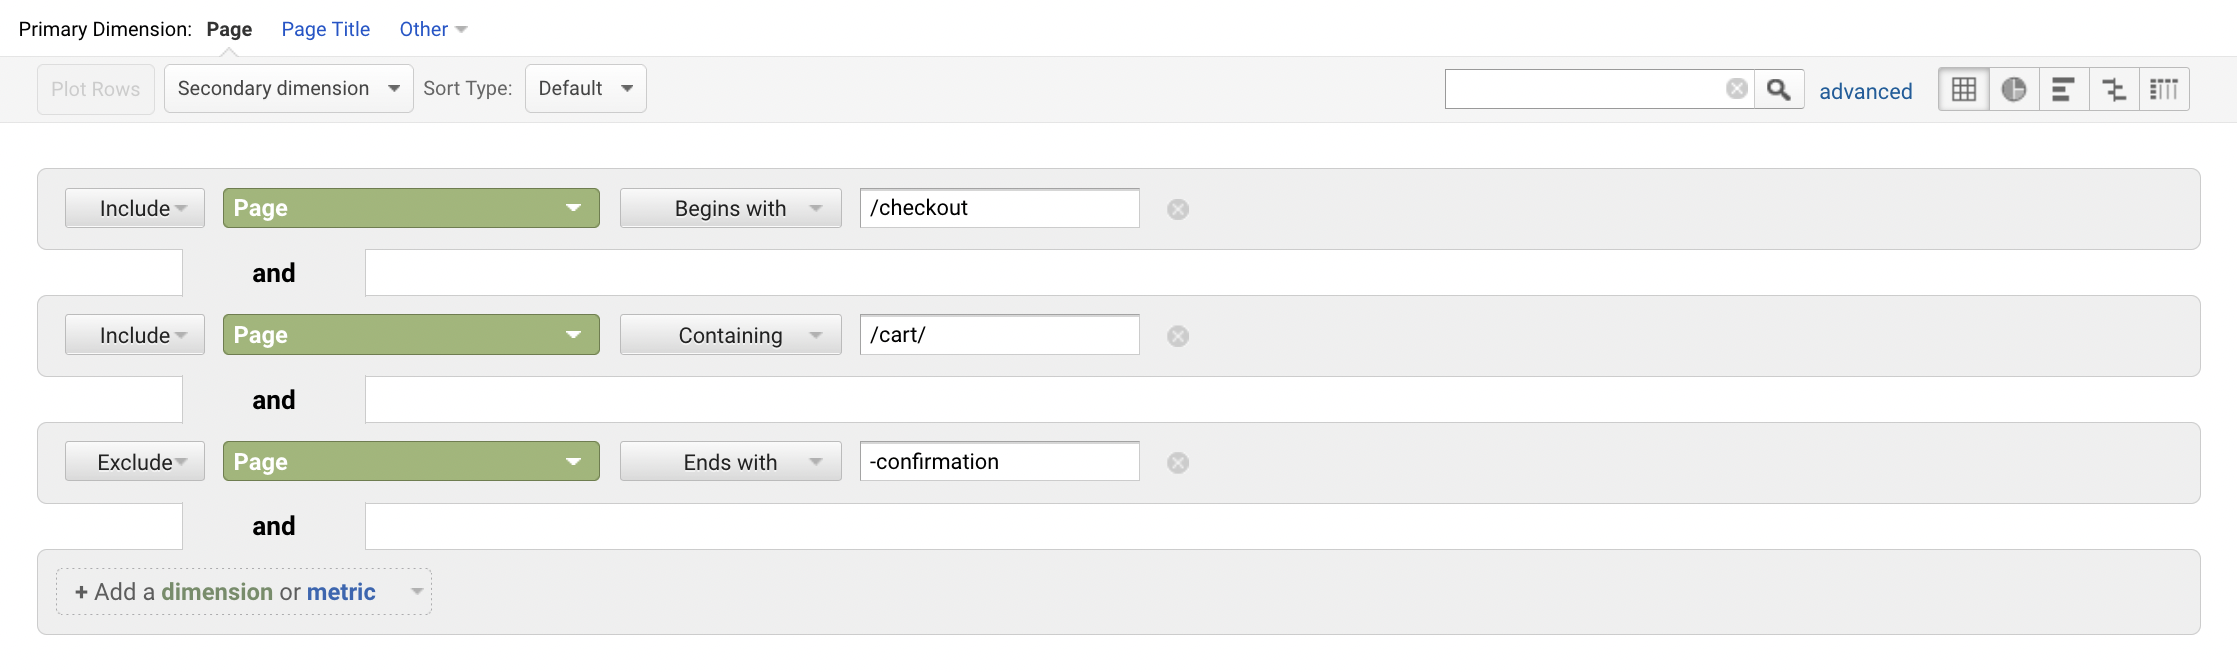
There is instead a functionality for “editing” the table view – but even this is heavily limited, while also being much more difficult to use than the old advanced search feature. One major obstacle, for example, is that you can only add one filter for each criteria category. (That is, if you’ve already chosen a “Page” criteria to filter by, you can’t add a second “Page” criteria – it has to be a different category. So no easy way to include or exclude multiple unique sets of pages in a single view).
Graph displays
Another major loss is the significant decrease in functionality and usefulness of the graphs in GA4 from their prior functionalities in GA3.
The graphs displaying above each table of raw data in Google Analytics 3 (“Universal Analytics”) have a huge amount of functionality and are extremely dynamic. You can…
- Choose which specific data type/value you want to see on the graph from an exhaustive list of options (e.g. pageviews, entrances, exit rate)
- Graph multiple datapoints against each other, for multiple different segments (e.g. total visits and unique visits, for all users and just buyers)
- Select different row entries from the main data table below, and add unique lines to the graph for those specific rows
- Choose to view the data on the graph displayed by day, week, or month – and in some cases, even by hour
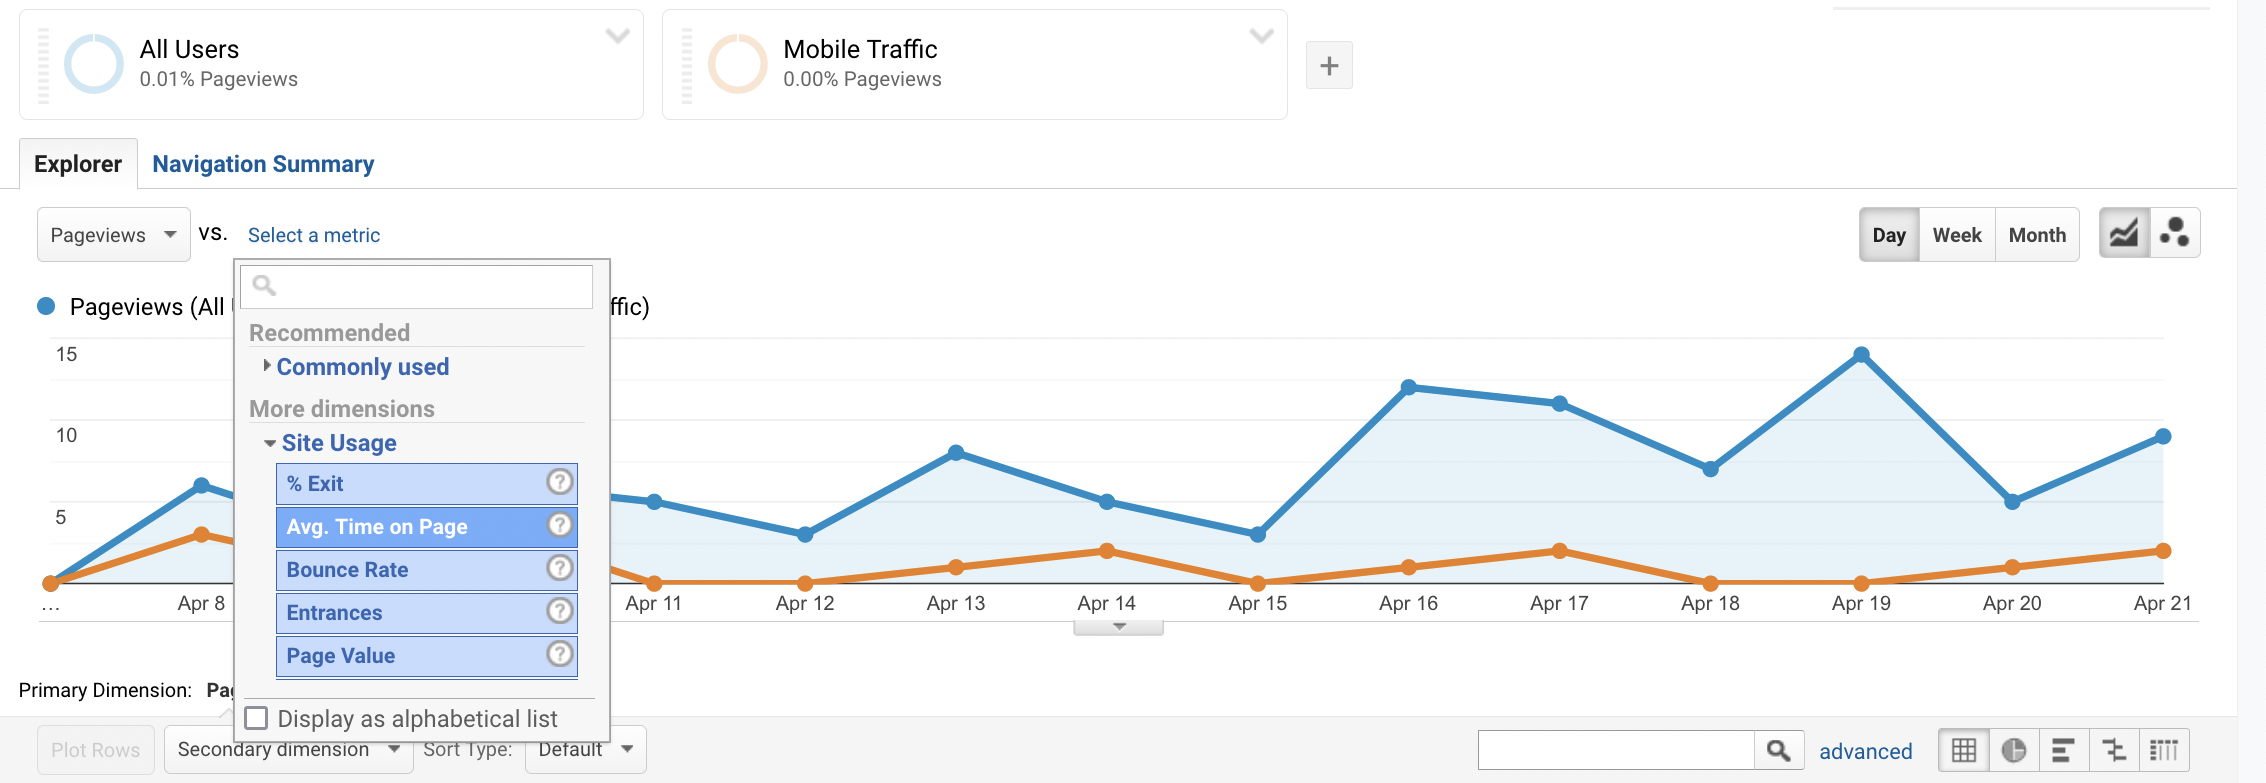
Literally all of these capabilities are gone from Google Analytics 4.
Data is only ever displayed by day (no options for weekly or monthly totals). You can only ever see the lines for the top 5 entries in the dataset you’re viewing – even if you’ve searched and filtered within that dataset to only include other values. (Also, infuriatingly, the graphs do not have a line for the total – only the top 5 individual values. There’s no way to add this.)
There’s no way to add the lines for specific rows of interest from the data table to the graphs. You also cannot choose whichever type of data you want to see on the graph – it can only graph the values for whichever column you’re currently sorting by in the table. (That is, you can only see the trend lines for bounce rate while the data table is sorted by bounce rate). Nor can you choose to graph several datapoints against each other at once (say, bounce rate vs average time on page).
Relatedly, while viewing a big table full of data, you also cannot click on an individual row/entry and sort your entire view down to just the data for that item. (This is another method for easily viewing the trend line for literally any entry in your table in UA/GA3).
Disclaimer: All assertions of what can and cannot be done in GA4 are based on our experience over months of usage; it is conceivable that there is some way to achieve some of these things. If so, though, we have not been able to figure out how, and you likely won’t either.
Segments
The extremely useful segments feature from Universal Analytics is gone from GA4, replaced with a much weaker, less effective “comparisons” feature.
Firstly, the criteria available for creating new “comparisons” is heavily reduced from the many options that were previously offered in Google Analytics 3. Some of our most frequently used segments that our team relied on in GA3 are impossible to recreate with this feature.
Secondly, GA4 comparisons cannot be saved and re-used later. They have to be recreated every time you want to use them again. It is possible, however, to convert comparisons into saved segments specifically in the “Explore” tab – an advanced sandbox for creating custom reports completely from scratch. Unfortunately, this is not as useful as it sounds; read the next section to learn why.
“Explorations”: GA4’s substitute for missing features & data
Google Analytics 4 does have an “Explore” tab that appears to enable a whole lot of customization. It’s possible that many of the things we’ve listed above as missing from GA4 can technically be accomplished through custom setups in the Explore tab.
The biggest problem is that it looks like this:
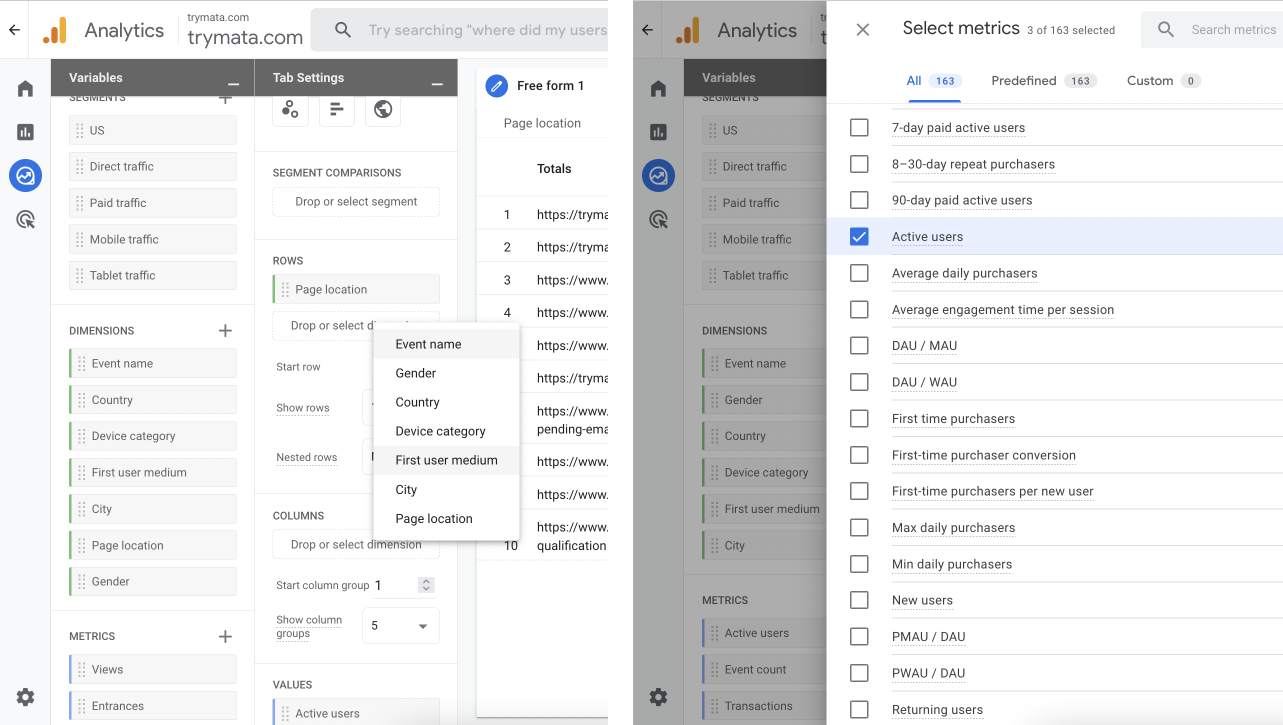
The interface for creating any custom data views is nightmarishly difficult to figure out, and utterly overwhelming. Literally every aspect of the tables you want has to be set up from scratch, chosen from enormous lists of every possible element – and all this is frequently organized under completely unfamiliar, jargon-filled headings and labels.
Personally, I’ve ventured into this section multiple times after getting my hopes up, only to get completely lost and discouraged every single time, ultimately giving up. If you’re not an expert (and don’t want to put in tons of time to become one), this entire section of GA4 is very hard to get value out of.
The other big problem with GA4 explorations is that any customization you do here stays only in this tab. If you create a user segment here, for example, you can only use that segment within the Explore tab. There is no way to apply it to any of the datasets in the default reporting tabs.
Essentially, this area of GA4 is almost completely cordoned off from the rest of the platform, and does little to enhance the experience of everything else on the new version.
Related read: Choosing and collecting UX KPIs
Conclusion: Outcomes of the GA4 changes
All in all, our experience with GA4 is that there’s just less data available than we’re used to, and almost everything is harder and takes several more steps to get to.
Our ability to easily and efficiently retrieve key metrics from the platform remains significantly reduced.
Ultimately, in many cases we have been able to continue tracking old KPIs and other datapoints. In some cases, those metrics had direct corollaries in the new version; in others, we had to find a way to access or approximate them. A smaller number of KPIs we have had to stop collecting from Google Analytics entirely.
Fortunately for our team, we’ve been able to supplement our metrics-tracking with the Trymata Product Analytics tool – and, to inform the development of that tool with the shortcomings of Google Analytics 4! While it wasn’t originally intended to be a Google Analytics alternative, we’ve been able to shape it into exactly that and more.
In our next article, we’ll discuss how our team has been able to replace much of prior reliance on Google Analytics with Trymata Product Analytics. Keep your eyes peeled for this next installment.
Update – read now: Switching away from Google Analytics 4
If you’re also looking to switch away from Google Analytics as the upcoming transition to GA4 approaches, get in touch with us – or see what you can do with a Trymata free trial!