


Last week, we wrote about our challenges transitioning from Google Analytics 3 (“Universal Analytics”) to GA4. This article is a follow-up to that piece, describing how our team has dealt with the difficulties of Google Analytics 4 by supplementing our web analytics data with the Trymata Product Analytics tool.
Transitioning off of Google Analytics 4
One of the major factors that has aided our team in dealing with the difficulties of the new GA version has been the website analytics data from the Trymata Product Analytics suite.
Interestingly, we didn’t even build this tool primarily to be a replacement for Google Analytics – many of its benefits are more in line with behavioral analytics tools like FullStory and Hotjar. However, we also realized as we struggled with GA4 that it could in many ways supplant our reliance on Google for tracking website performance metrics.
This happy coincidence actually spurred our team to expand the web analytics data our Product Analytics platform offers, in order to more comprehensively stand on par with Google Analytics.
How Trymata Product Analytics matches up with GA
As we observed (and experienced) the changes in Google Analytics, we’ve worked to make Trymata Product Analytics a platform that can serve as a worthy replacement for Google Analytics 3.
For one thing, almost all of the datasets available on GA3 are now available on Trymata Product Analytics too. Many of these will be gone from Google Analytics soon – but they will continue to be easily accessed on Trymata.
Things like page entrances and exits, campaign source & medium data, site search analytics, user flows and navigation patterns, and many more that will all be lost in GA4 have all been accounted for in Trymata’s Product Analytics.
For a full roundup of the data available on our product analytics tool and how it directly compares to Google Analytics 3, check out this Trymata vs Google Analytics comparison
Improving on the GA3/UA model
We haven’t kept Google’s exact wording and terminology for everything, though. In fact, we saw this as an opportunity to build a “better Google Analytics 3.” For all the useful data GA3 offers, it can have a pretty steep learning curve. As we’ve brought more and more data to our own platform, we’ve worked to do so in a way that will be easier to understand for non-expert users.
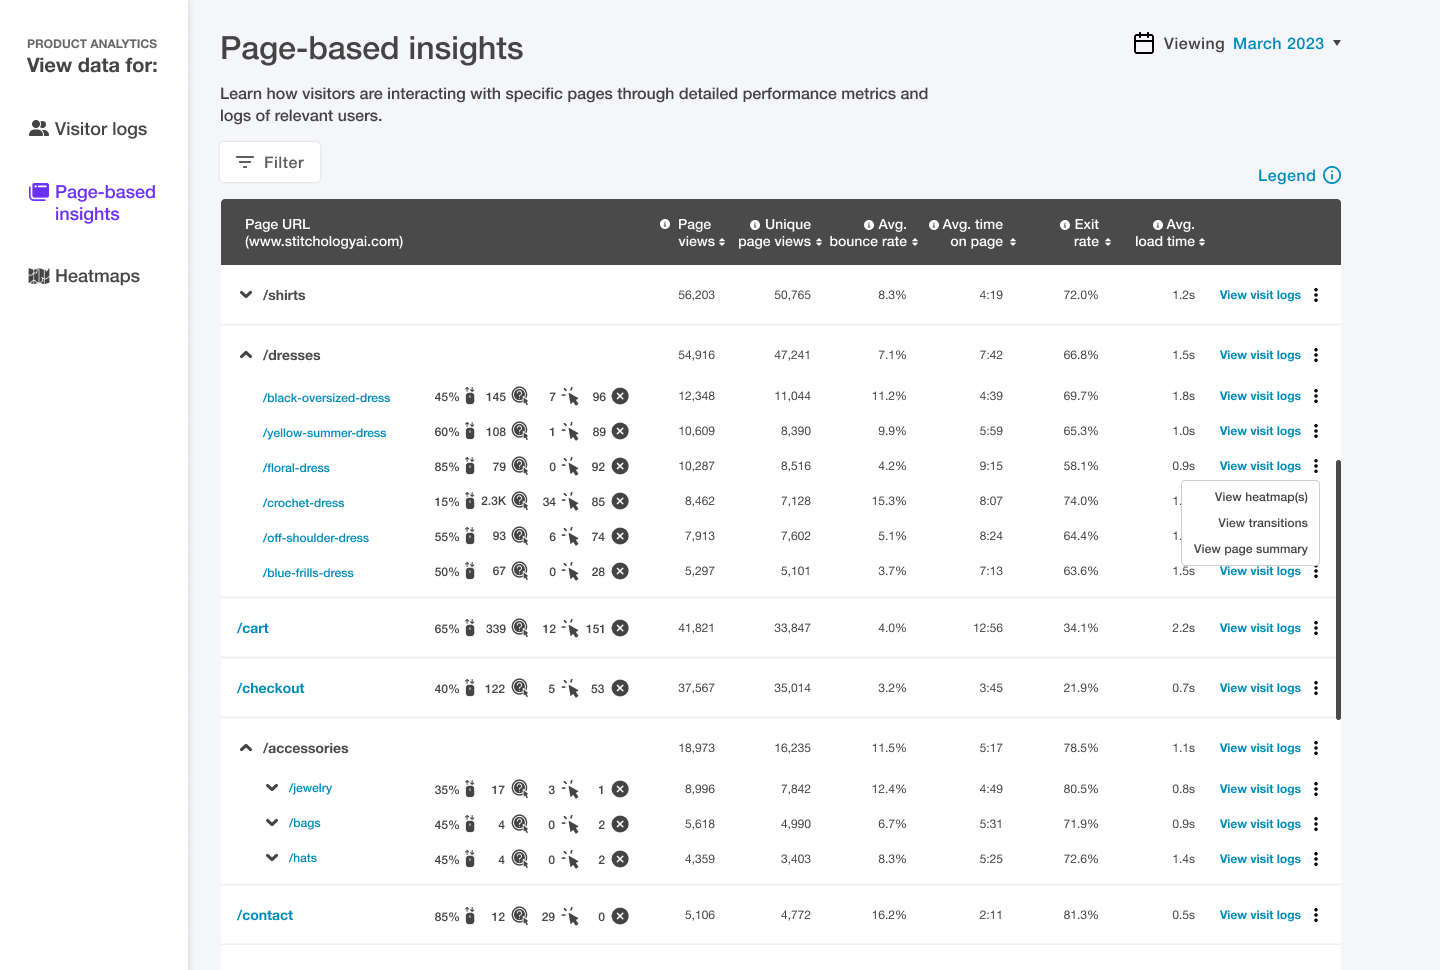
For example, on Google Analytics all of the data about webpages (number of pageviews, time on page, page bounce rates, etc.) have always been grouped under the “Behavior” section. While there are explainable reasons why that grouping choice was made, for someone new to the platform it’s not the obvious place to look. So our section for webpage data is called “Page-based insights.”
Surely many of us who have spent hours of our work lives on Google Analytics have wished for a more human-friendly experience on the platform. Based on how much worse GA4 has turned out, it appears unlikely we’ll ever get that from Google. Fortunately, we’ve found the opportunity to make those improvements ourselves.

Level up your web analytics
For those rueing the datasets and functionalities they will lose with the GA4 transition, Trymata is a great Google Analytics alternative that will preserve much of what you love about GA3, while improving on the things you may not have liked so much.
As noted above, though, we’re not just a Google Analytics replacement. In fact, our platform was mainly launched to provide other analytical tools and benefits not even available in GA.
In addition to the standard web analytics datasets comparable to Google Analytics, you’ll also find advanced behavioral analytics tools that enable you to look deep into the human side of the sessions happening on your website to truly understand what makes your users tick.
Human insights integrated with website data
While Google Analytics has always been a great tool for capturing a macroscopic view of your site performance, it’s not a tool meant for understanding the finer points of human interaction on your platform.
Other tools have gained popularity for their ability to fill this gap with features like session replay, heatmaps, and user frustration filters. However, none of those tools have combined that valuable human insight with the big-picture data, thus leaving site owners reliant on multiple platforms to reach a holistic understanding of what happens on their website.
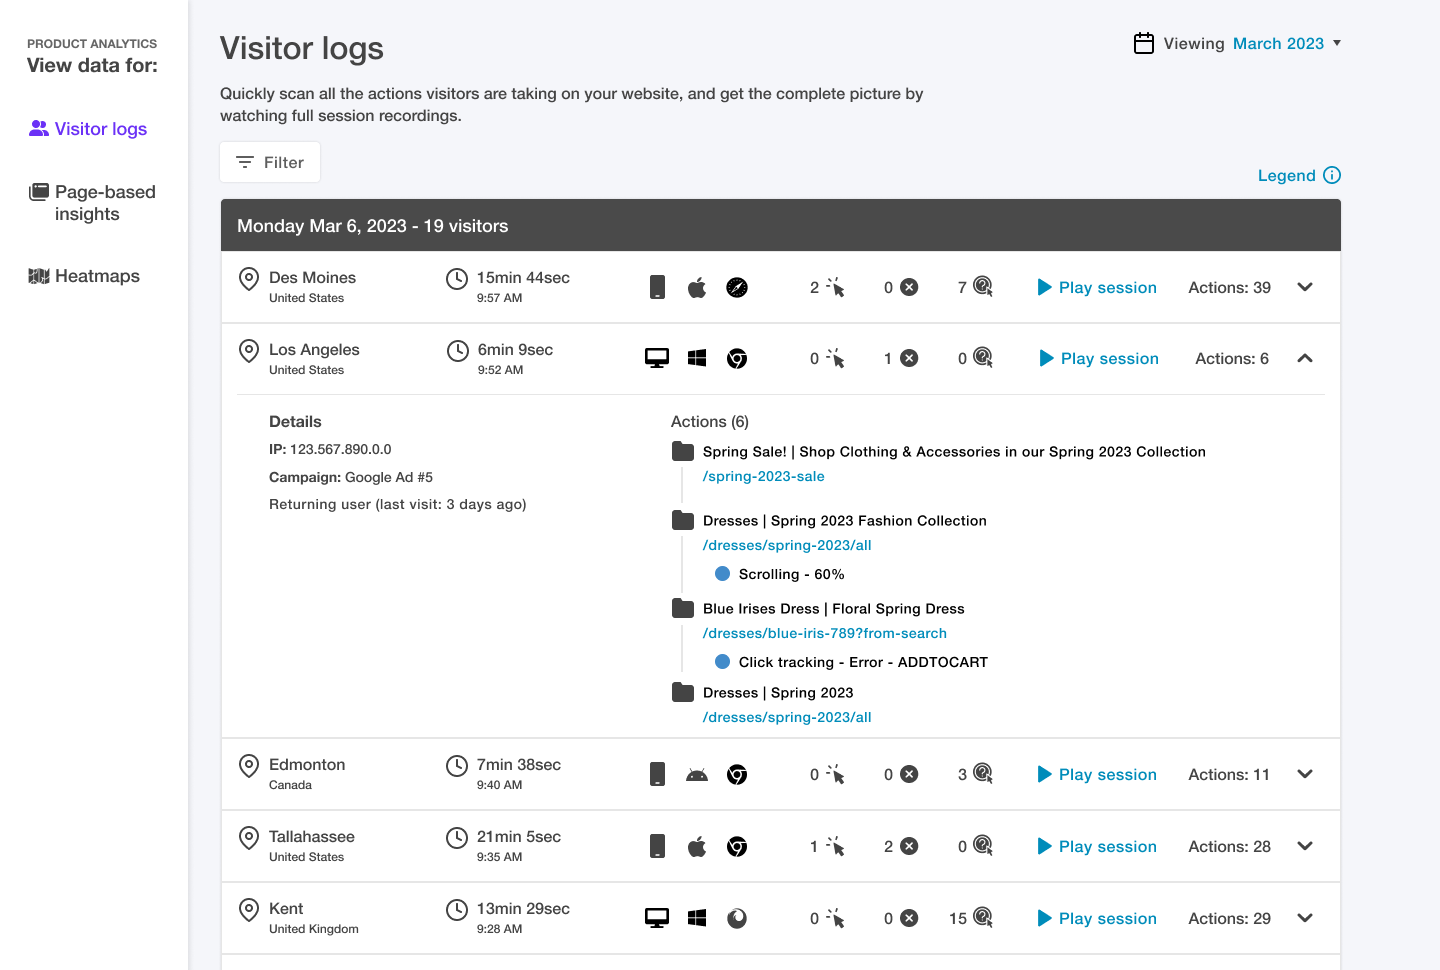
Trymata’s website data is directly integrated with features that give you a peek right into your users’ heads. Notably, our visitor logs and session replay features allows you to quickly find user sessions of interest, and see exactly what those users were doing.
If you’re not familiar with the term “session replay,” it essentially means that we collect a log of every click, scroll, navigation, and other action that a user performs while on your website, and then reconstruct those (using screenshots of your webpages) into a watchable video.
Users’ identities are anonymized, and sensitive inputs like passwords and usernames are hidden – but the important insights remain. With these videos, you can take a walk in your users’ shoes, and see what they see. You can also skim through a written summary of all those session actions, since few people have time to watch every single relevant video.
Critically, these session logs and videos are tied directly into your web analytics data on our platform. In other words, you don’t have to scroll through a giant library of every single visit, wondering which ones you should look into. Rather, you can access filtered lists of relevant sessions for each data point.
Looking into the high bounce rates on one of your landing pages? You can pull up the visitor logs for users on that page, and see what happened in those sessions.
Trying to understand the pathways that users are following when they reach a goal you’ve set up? You can pull up the visitor logs for users who completed that goal, and see what they did.
Escape from Google Analytics!
You don’t have to resign yourself to sticking with the new, downgraded version of Google Analytics. Frustrating as GA4 is, it’s proven to be an opportunity to break away from a platform that was never that great in the first place.
Our team has been excited about the work we’ve done to build the Universal Analytics alternative that we always wanted, and we hope that you’ll feel the same!
If you’re nervous about abandoning such a mainstay tool like Google Analytics, we encourage you to try out a completely free 2-week trial of Trymata Product Analytics. No credit card required, and no strings attached. Learn what web analytics can really be!

What to expect about Google Analytics 4: For non-expert GA users