


For any business with an online presence, product analytics can be an invaluable tool to help you understand how customers interact with your website. With the right product analytics tools, you can gain insight into customer behavior, understand user frustrations, and optimize your site for a better digital experience.
Visitor logs
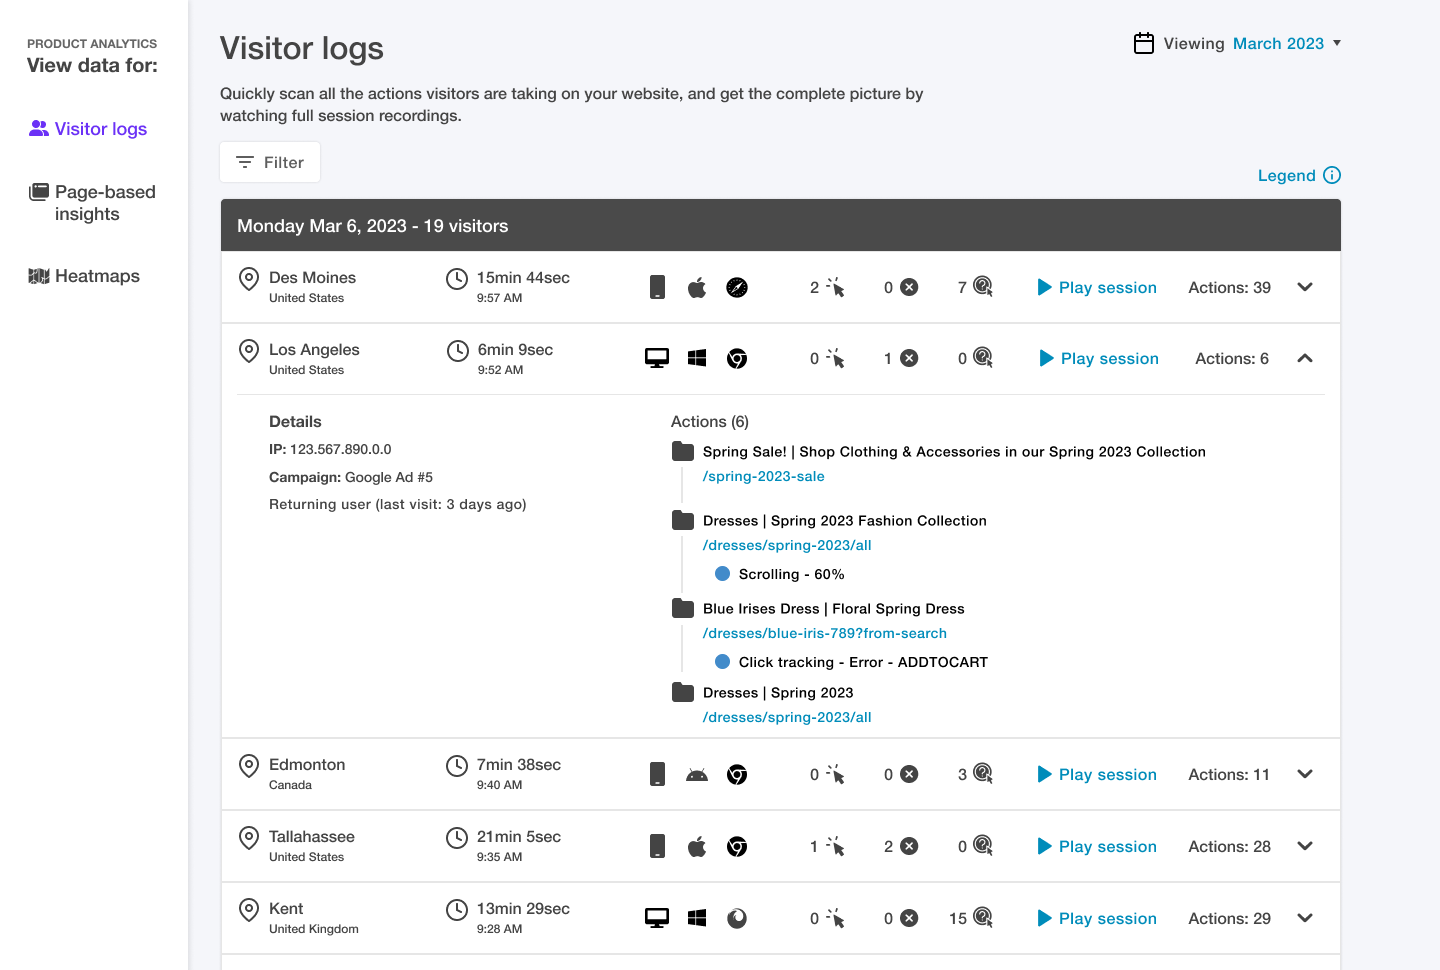
Website visitor logs can be a valuable resource for analyzing product performance metrics. They provide detailed information about when users visit your website or app, including the pages they visited and how long they stayed on each page.
This data can be used to track user engagement and identify areas where users may be having difficulty navigating your product.
Session replay
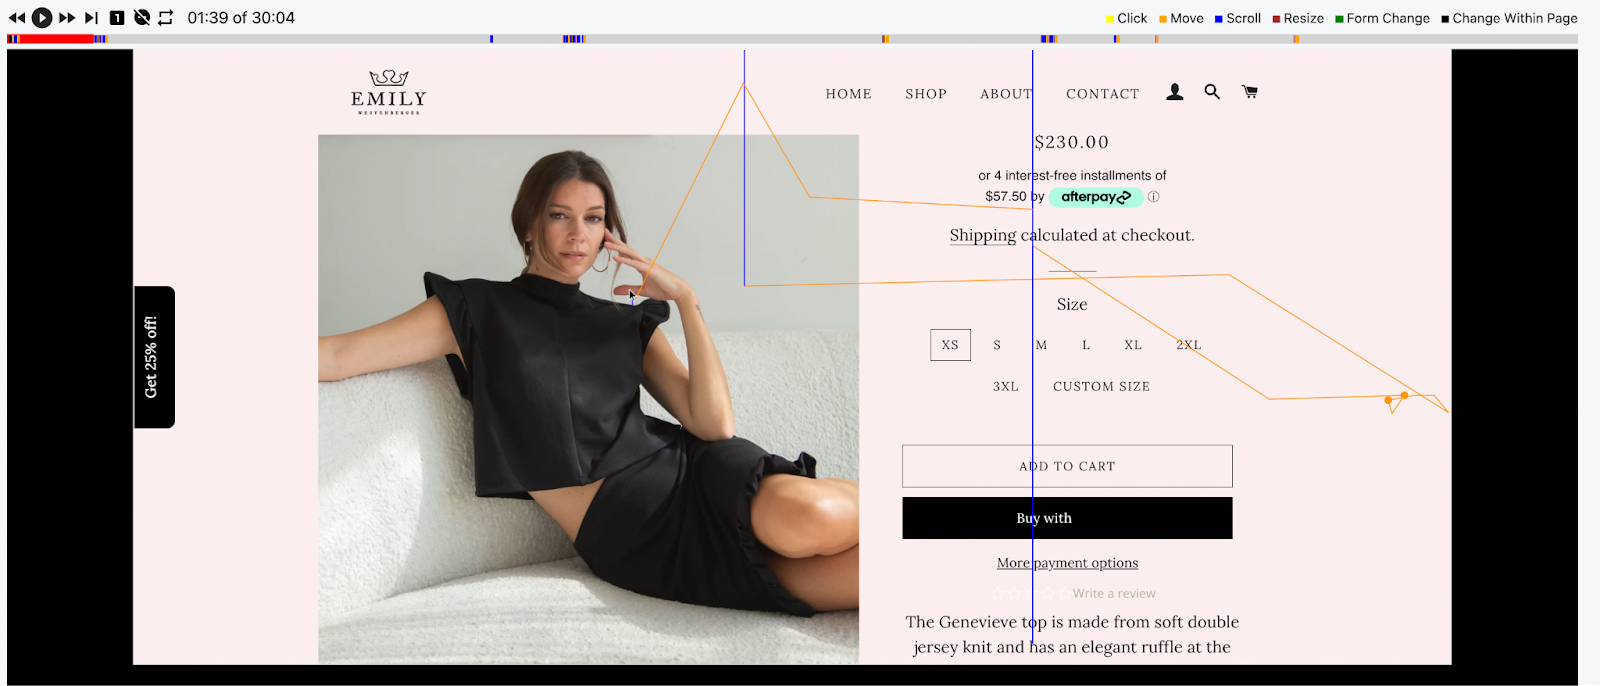
Session replay is one of the most powerful product analytics tools available. It records a log of all user interactions on your website or web application – every mouse click, keystroke, scroll, navigation, and more – and then reconstructs those interactions into playable session videos, so you can watch exactly how users experienced your site.
This engaging and easy-to-understand video data can be used to identify user behaviors and uncover hidden issues that may be affecting the user experience.
User frustration indicators: Rage clicks, dead clicks, and error clicks
User frustration indicators are another great product analytics tool. They allow you to detect when users are frustrated with your product, such as when they take too long to complete a task or when they abandon a task before completion. This data can be used to identify areas of your product that need improvement, helping you create a better user experience.
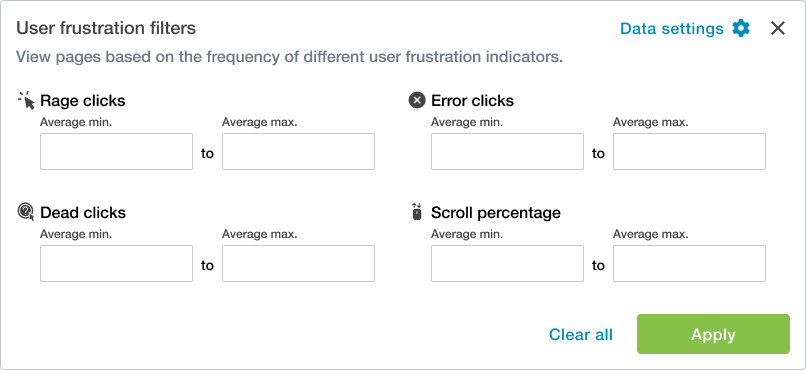
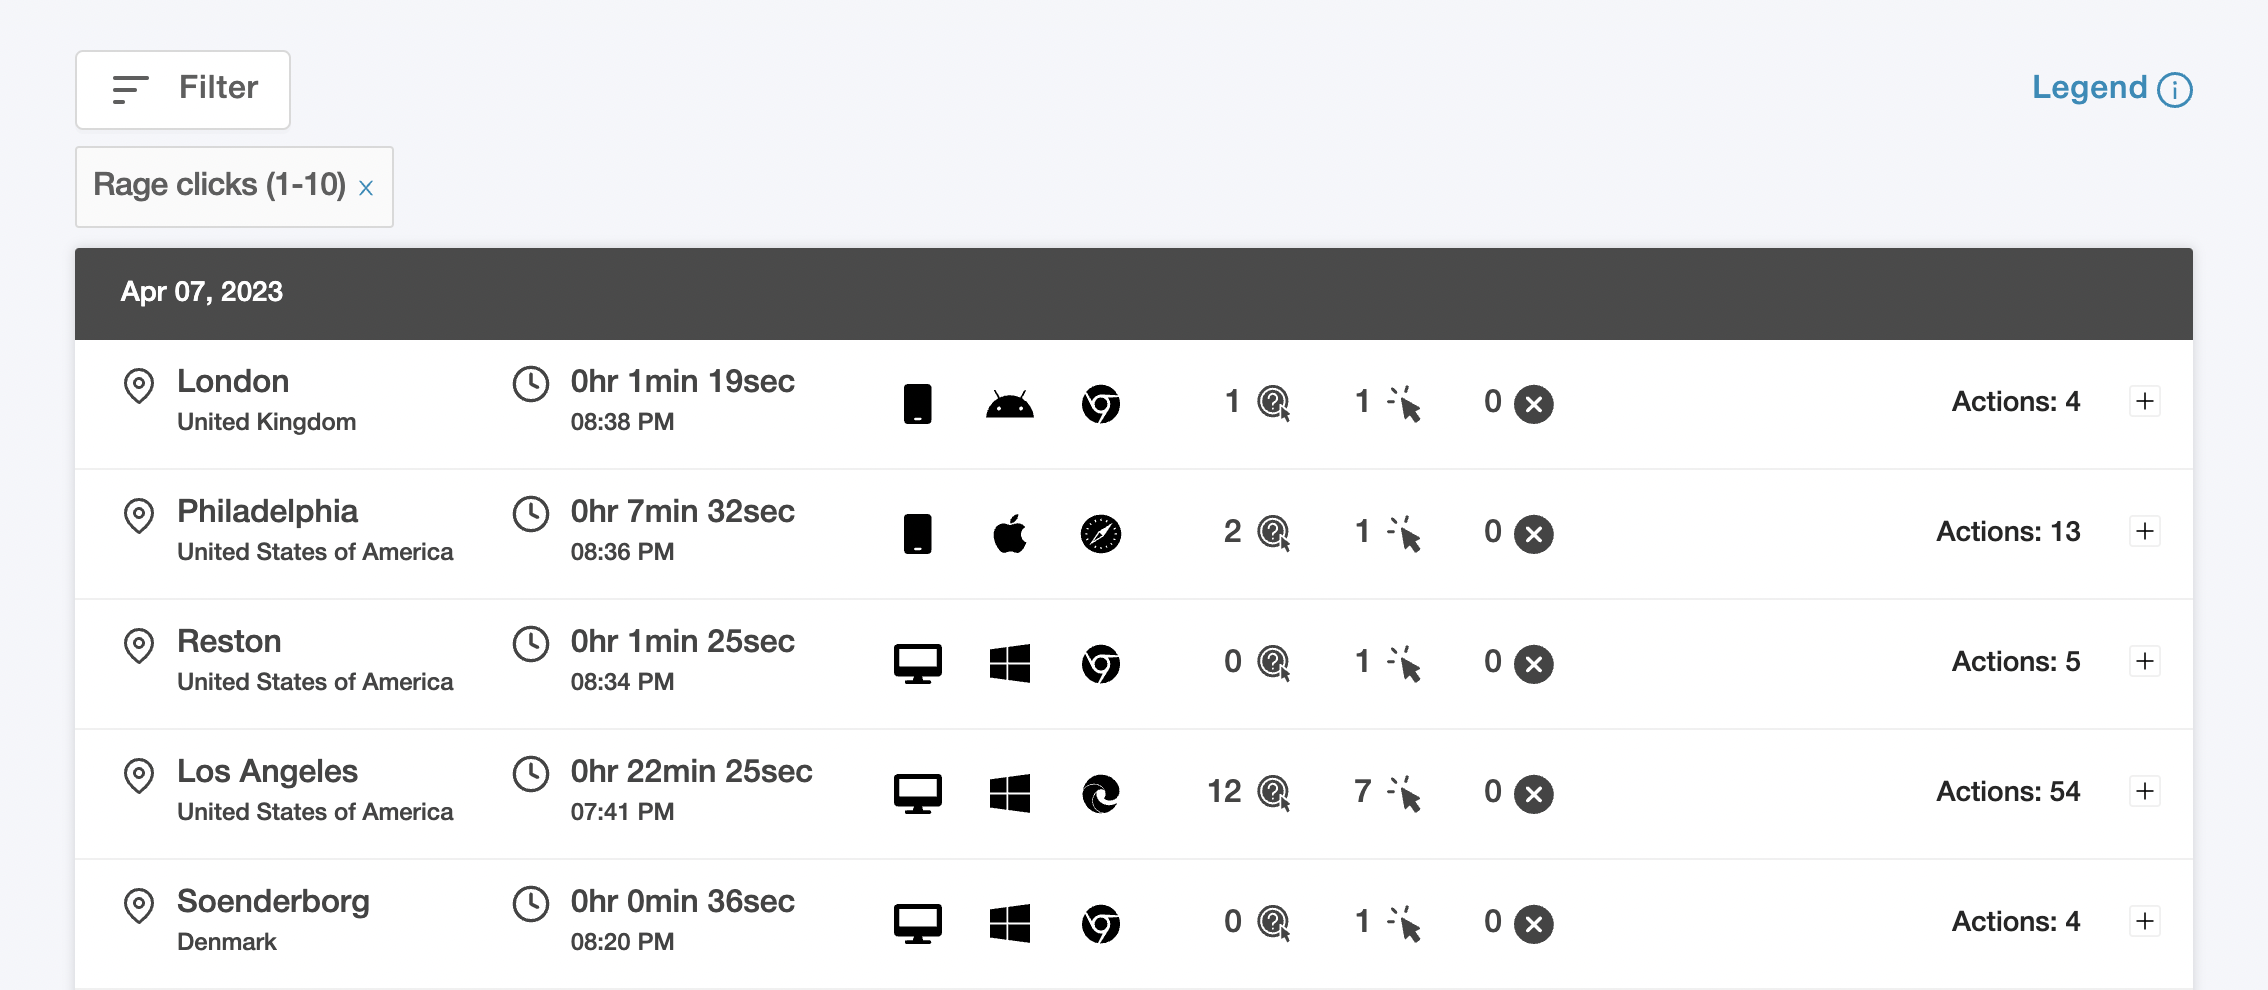
You can set filters for rage clicks, dead clicks, and error clicks to find user sessions or website pages where these frustrated moments occurred.
Rage clicks are like punching your mouse or touchpad because it does not do what you want. It is triggered when a visitor clicks rapidly multiple times on an element on your website. Rage clicks often signal that this part of your website did not react the way the visitor expected it to, so you may be able to run a usability test to take a closer look at it.
Dead clicks are clicks that have no impact to the page. For example, if a visitor clicks on an image to zoom in but nothing happens, this would result in a dead click. If your users are experiencing dead clicks, you can easily check their sessions to identify their frustration points and quickly improve your user experience.
Error clicks are clicks that result in JavaScript errors. In this scenario, visitors may not realize that something is not broken, but it is nonetheless a signal for you that a particular JavaScript element may not be working.
Heatmaps
Heatmaps are another very valuable product analytics tool. They provide visual representations of user interactions with your product, showing where users are moving their mouse, clicking, and how they are interacting with specific webpages.
Heatmaps can help you identify trends in how your visitors respond to and move through your site, areas that they’re paying attention to or skipping over, and other notable patterns, allowing you to make improvements to the user experience.
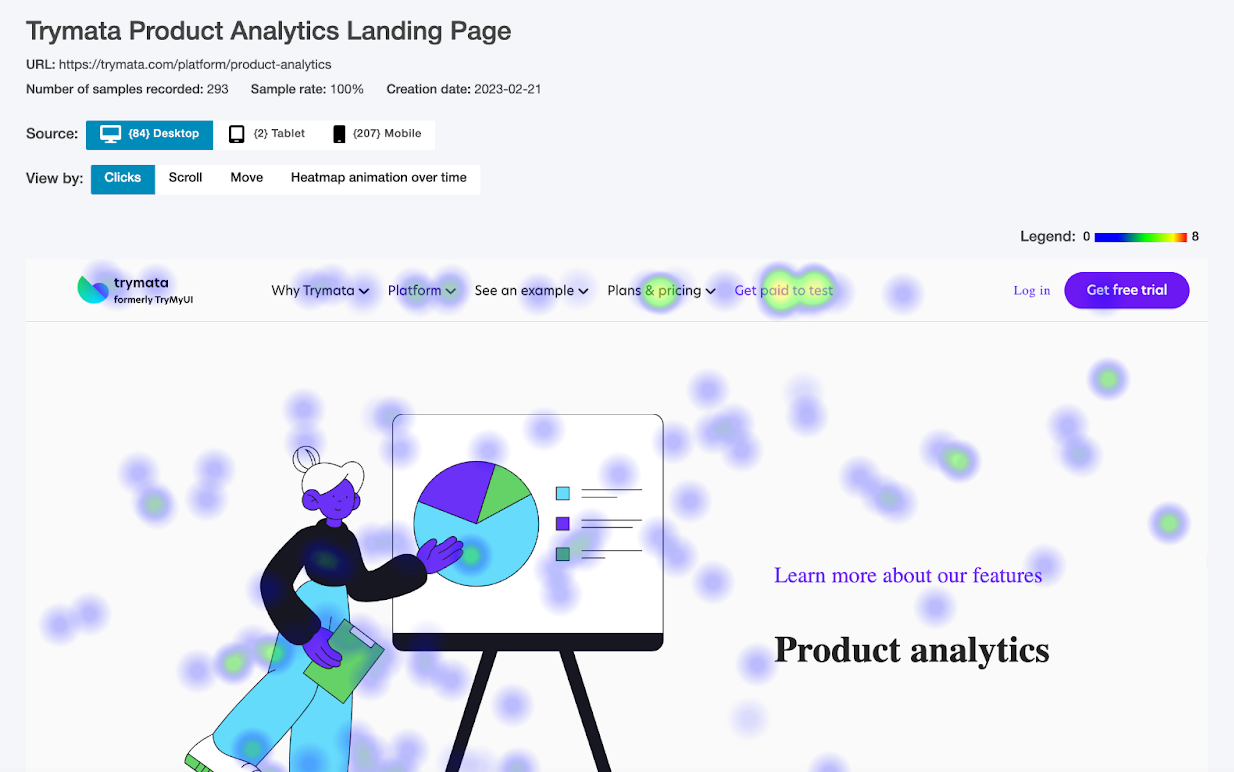
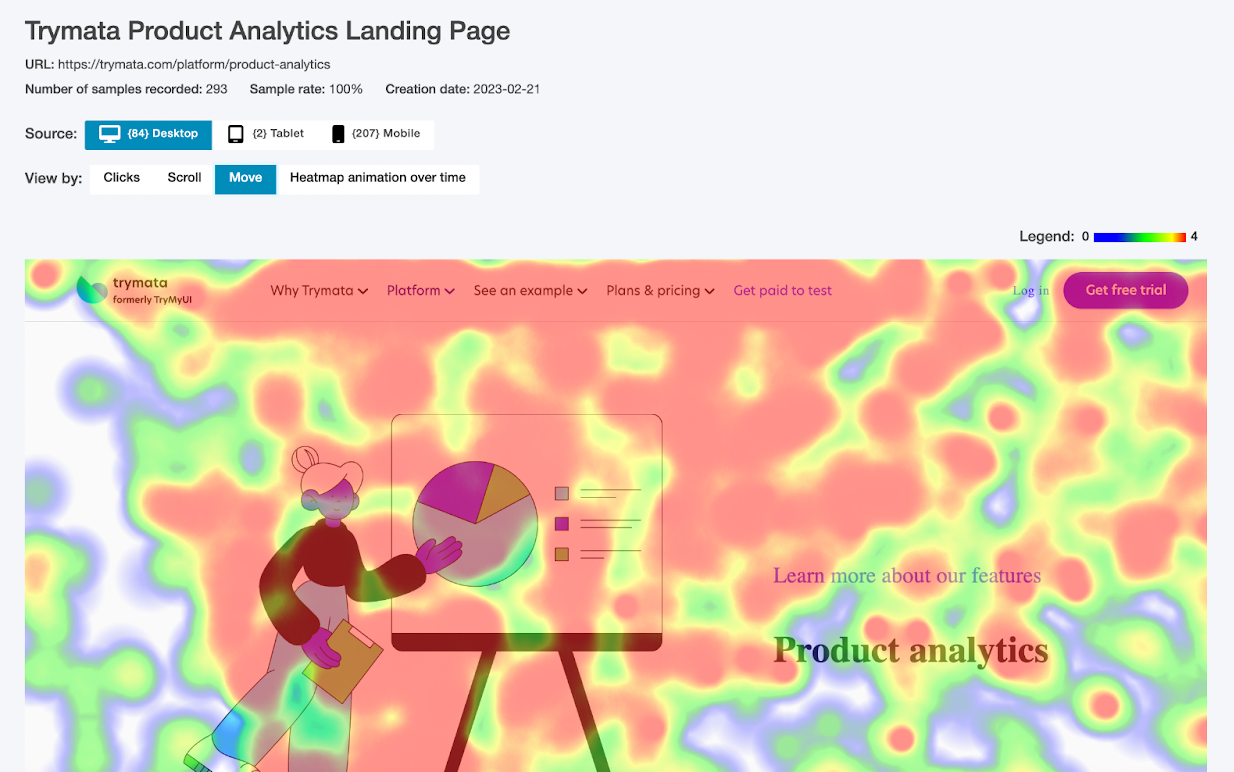
Different styles of heatmaps (all included with Trymata Product Analytics) display clicks, mouse movements, scrolling, and change over time. All of these features allow site owners to track what users are doing and looking at on the page.
By analyzing these behaviors, you can gain insights into how users’ mindsets, priorities, and needs, and make improvements to your designs accordingly.
Page-based insights
Finally, page-based insights are a great way to gain insight into how users interact with specific pages of your product and how your webpages are performing overall.
Page-based insights provide detailed data about what’s happening on all of the different pages of your site, including how users interact with individual pages, how many users are visiting each page (and leaving each page), how long they stay on each page, and which elements they interact with. This data can be used to optimize individual pages for better user experience.
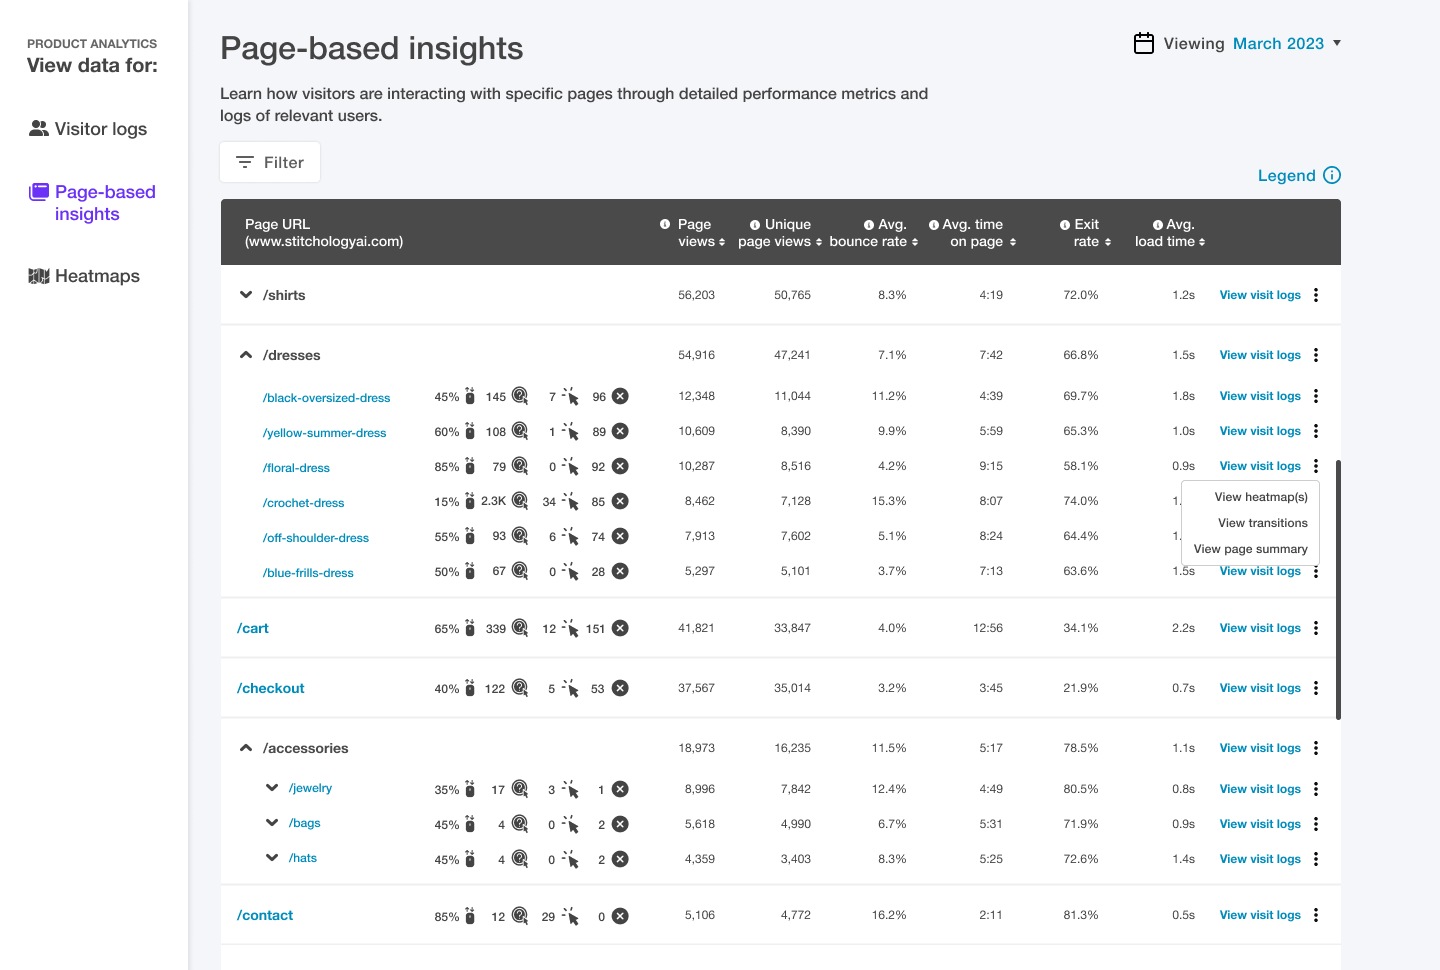
The page-based insights dashboard provides you with many of the same kinds of insights you would be able to get from Google Analytics, but makes it much easier to find and understand them. Not only that, it combines those pieces of data with other kinds of useful information like visitor logs, so that you can get a more holistic picture of the activity on each page of your site.
Taking your website to the next level with product analytics
Product analytics are a powerful tool to help you understand how customers and leads interact with your digital presence and products, and then use that understanding to optimize their experience. By basing your optimization efforts on real customer data, y0u’ll be able to convert even more brand new visitors, and keep your existing users happier!
With the right product analytics tools, such as session recording, visit logs, user frustration filters, heatmaps, and page-based insights, you can gain valuable insights found nowhere else, and reach new heights of success for your online business!