Heatmaps are a powerful way of visualizing how your users interact with a page. They offer more insights that are not as accessible from other analytical tools. UX designers, product managers, and marketing teams can all take advantage of the kinds of deep insights that heatmaps have to offer.
Types of heatmaps
In fact, there are several different types of heatmaps: click maps, scroll maps, and heat maps over time. All three kinds provide unique information that’s extremely useful for understanding patterns of user behavior.
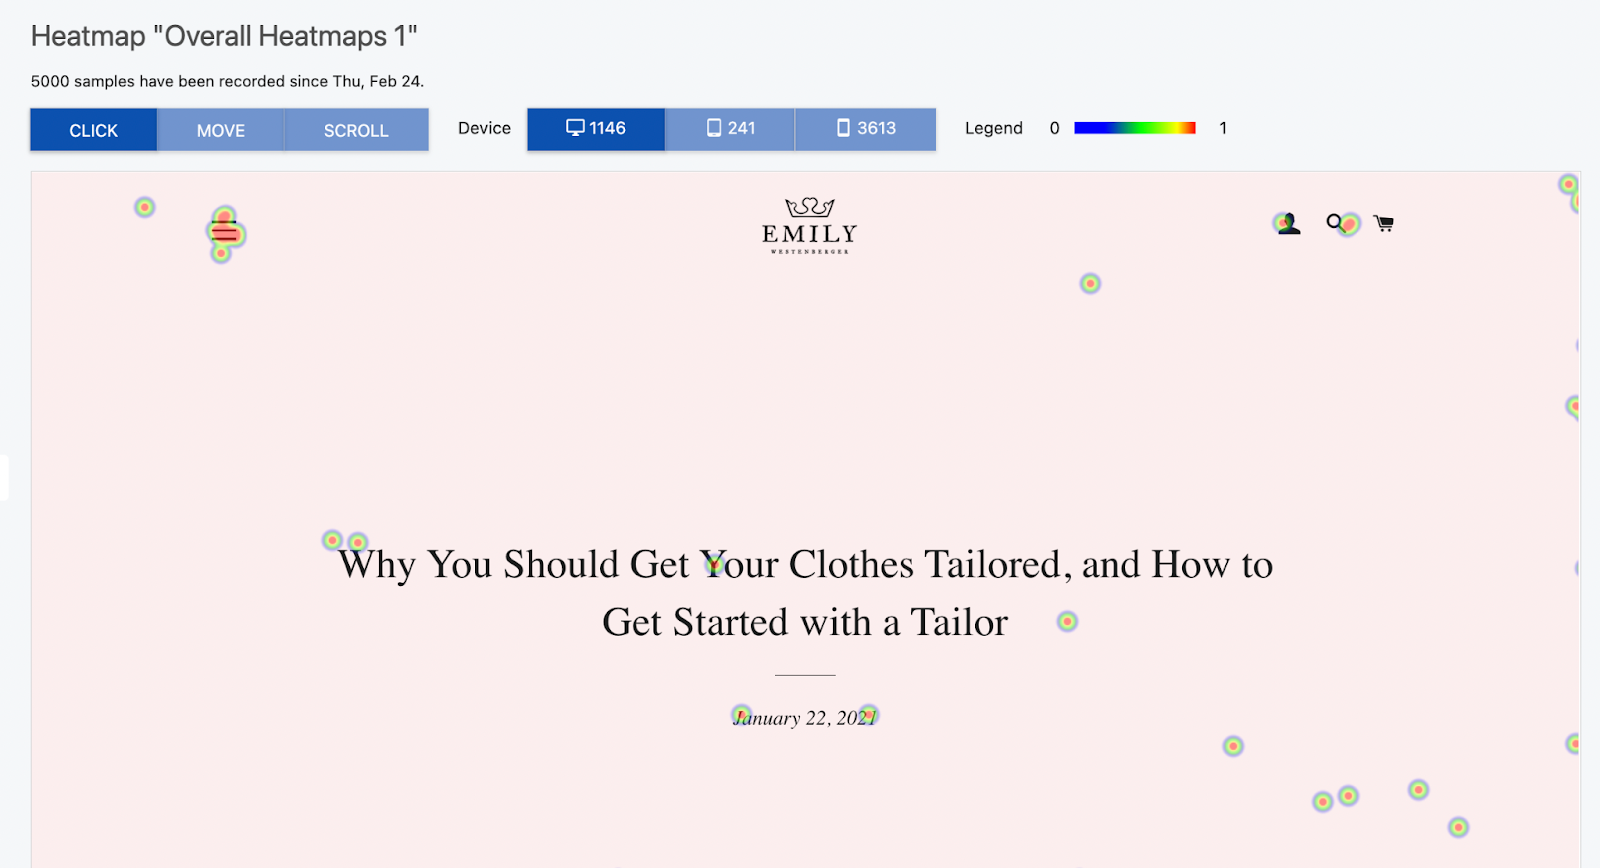
Click maps
Click maps in particular show you how users are clicking throughout a page. They highlight which elements of a page are most to least popular, which allows you to quickly identify trends across all your various visitors.

Example of a “click map” type heatmap
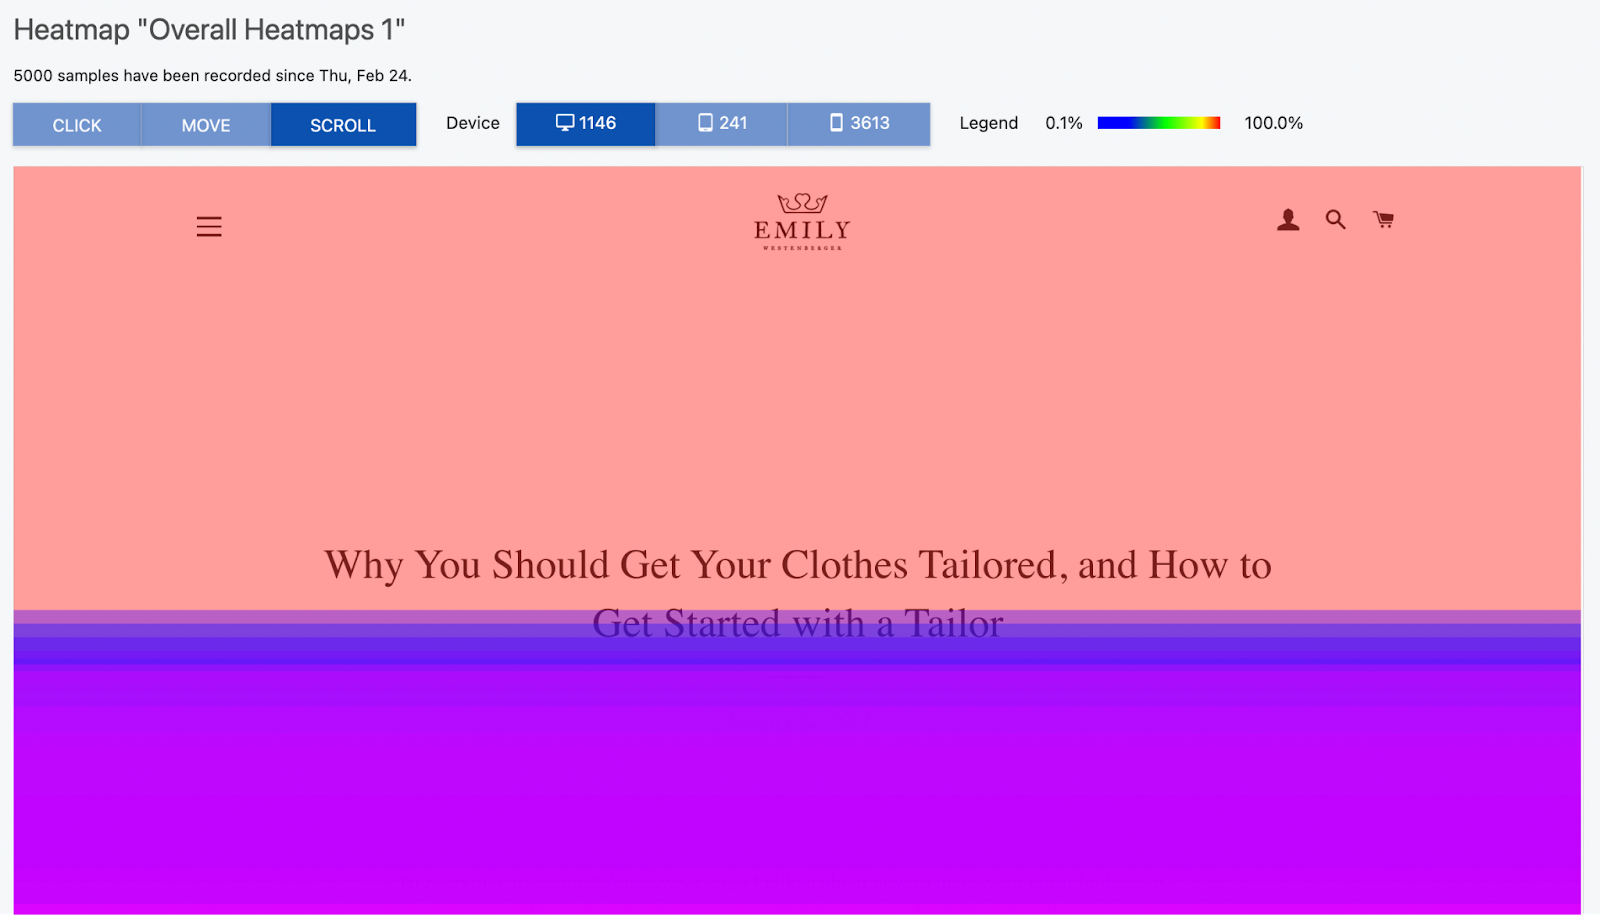
Scroll maps
Scroll maps on the other hand show you where users are scrolling throughout the page. It shows how many users scrolled to a certain extent of the page, and how many made it to the bottom of the page.

Example of a “scroll map” type heatmap
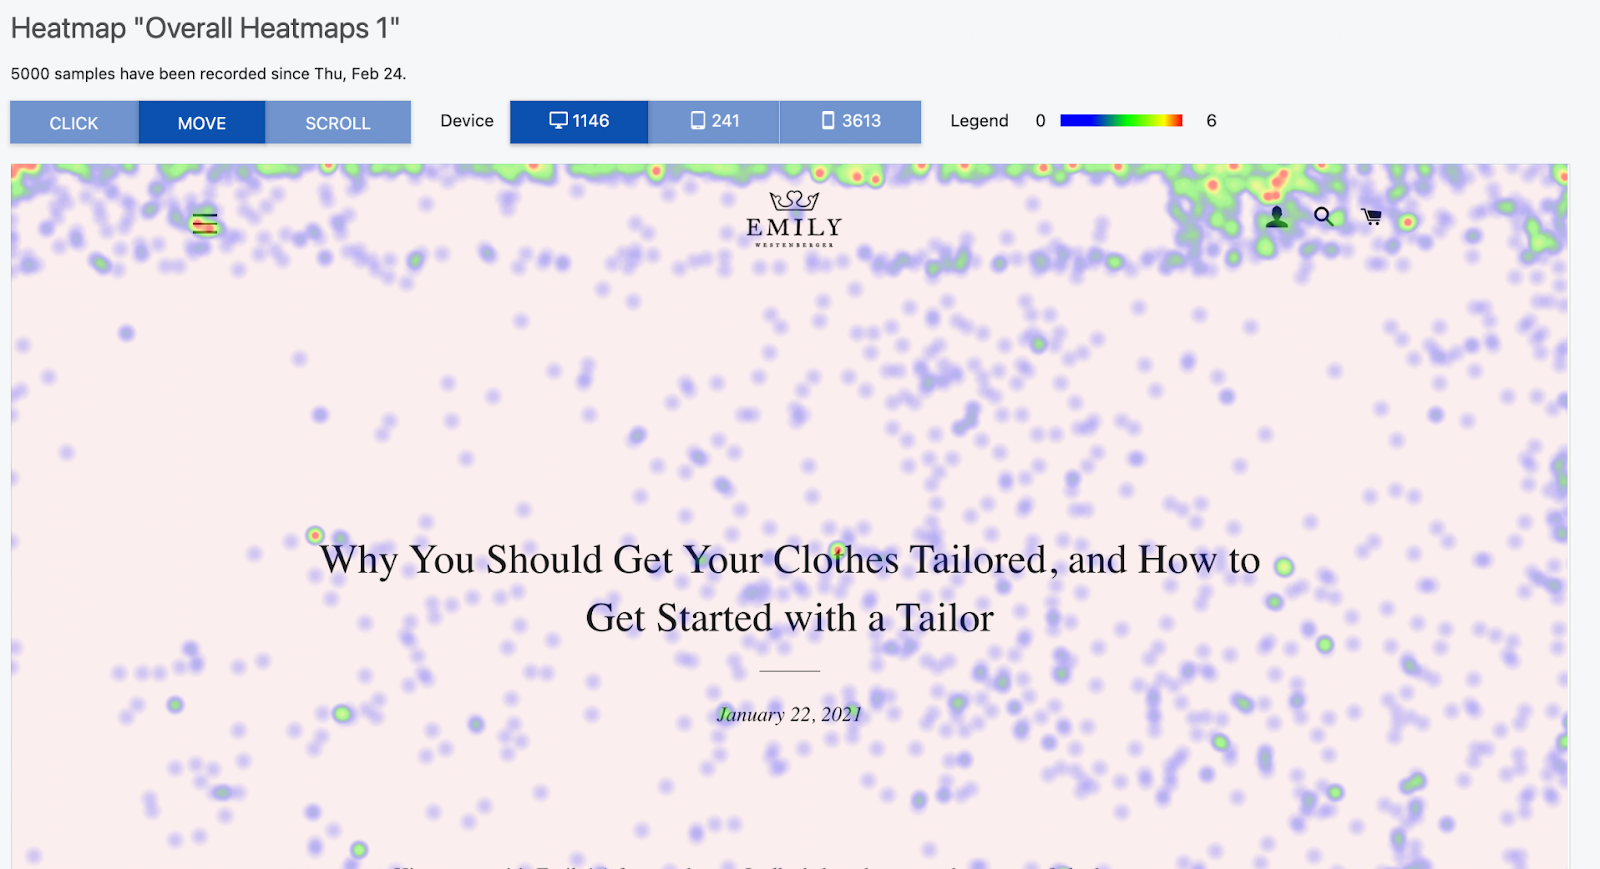
Heatmaps over time
Lastly, heatmaps over time show you how users have clicked over a length of time. This will reveal how users are thinking about the page and interacting over time.

Example of a “heatmap over time”
Ensuring privacy compliance
Trymata both respects visitors’ privacy preferences and protects private user information, while still providing you access to valuable data about user behavior and page performance. We are GDPR compliant, and have always prioritized data anonymization.
Get heatmaps for your website
Want to access all these varieties of heatmaps for your website’s most critical pages? Our Product Analytics suite offers this feature along with other powerful tools for learning how users interact with your digital platforms.
Get deeper insights into your webpage performance:


