


Many of the world’s greatest literary works have started with an individual given an impossible task: the Twelve Labors of Hercules; hunting a great white whale; choosing between Edward and Jacob… but UX research doesn’t need to be a Herculean task, and with TryMyUI, it isn’t!
With a suite of both quantitative and qualitative tools, your UX research can be thorough, intuitive, and easy to share and collaborate on. Below is an overview of a few of our most powerful quantitative tools for aiding researchers in their laborious hunt for data.
Do more: How to set up your first remote usability test on TryMyUI
UX Diagnostics: Slaying quantitative UX data
Do you know how Dr. Van Helsing and company slayed Dracula? Research and data collection. With slow and steady strategies and meticulous and crafted methodologies, the most infamous vampire in fiction stood no chance.
Through careful bookkeeping like logging his movements, habits, referencing archaic tomes of antediluvian knowledge, and so on, the otherwise ill-equipped crew of Victorians were able to vanquish the infamous count.
Like with vampire slaying, hard data and teamwork is the backbone of all successful quantitative UX research and user testing. TryMyUI’s UX Diagnostics makes measuring your product’s usability simple with a battery of metrics mapping out the user’s journey, such as psychometrics, task usability scores, task completion rates, and task duration data. Go prepared with a usability testing checklist as well!
The results are easy to share and interpret and can be tailored to focus on specific users with the check of a box. UX Diagnostics in another piece of making the customer journey visual.
Learn more: How to navigate the results of your first remote usability test on TryMyUI
Psychometrics
Our psychometric surveys are a method for measuring overall usability of a website or app. They are administered after a user completes the video session of their test.
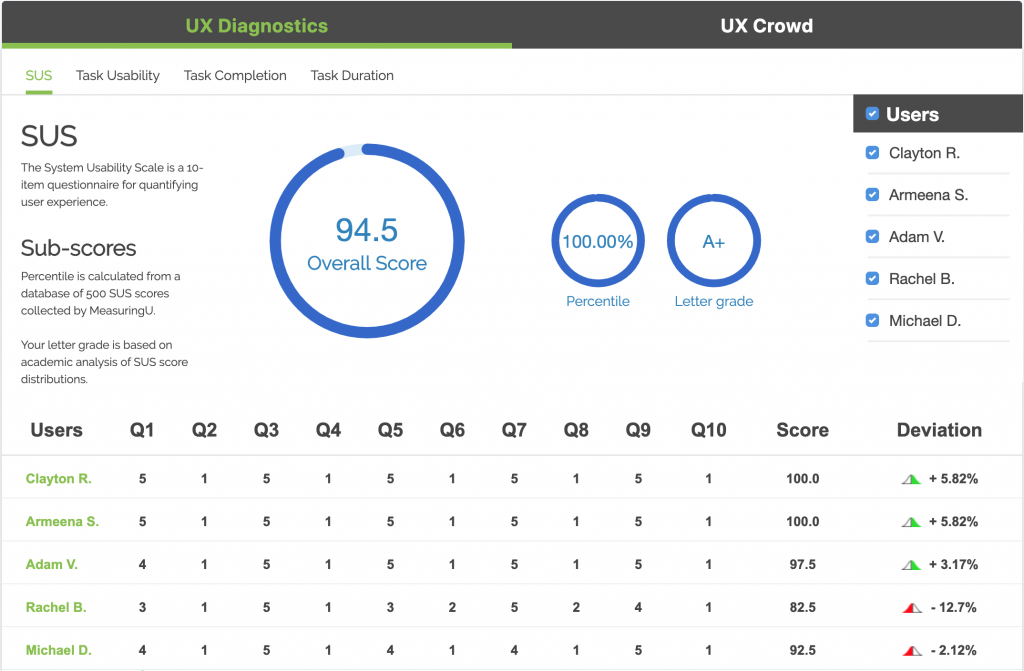
SUS is a long-time industry standard user testing metric that generates an overall usability score for your user experience. With SUS scores, you can quickly see which users struggled the most with your design and target those areas for improvement.
The PSSUQ survey has more questions, a more fine-grained response scale, and sub-scores for system usefulness, information quality, and interface quality. Read our comparison of SUS and PSSUQ!
The ALFQ is a TryMyUI original that’s especially great for determining how successful a digital product might be in addition to its usability.
Our latest SUPR-Q psychometric measures more abstract qualities such as trust and loyalty (by including the NPS). Read more about how to paint portraits of your users with SUPR-Q and NPS and see how it can impact your e-commerce UX!
All these user testing surveys quantify UX in their own way and provide unique opportunities for uncovering quantitative insights.
Learn more: user testing better products and user testing new products
Task usability
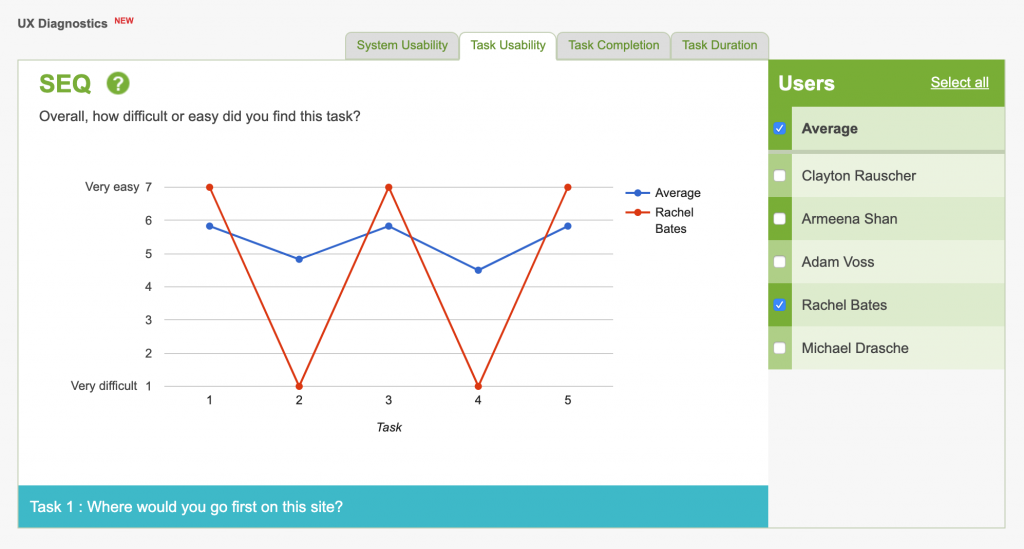
We use the Single Ease Question (SEQ) to measure individual task usability. The SEQ is a one-question survey after each task of a user session, designed to quantify the usability of individual tasks in a task-based usability test.
After completing each task, the user rates the difficulty on a scale of 1 (Very difficult) to 7 (Very easy).
You can see the fluctuations in usability over the entire user flow and know immediately where the biggest dips and pain points occur.

Task completion
See which tasks challenged users the most with task completion rate data, a simple gauge of how many testers successfully finished each task as determined by the testers themselves.
Like the task usability ratings, these are collected during the user video session. At the end of each task, users mark if they were able to complete the task with a simple “Yes” or “No.”

Task Duration
Task duration data is a measure of the average time spent by users on each task. TryMyUI collects this in the background of each user test, time-stamping where each task begins and ends for testers.
The benefits of UX Diagnostics for UX researchers is probably pretty apparent by now. But if you need to convince someone else on your team or company, here are some of the most compelling advantages of the feature:
- All of the collected data will enable you to build a mental framework of your study’s results, honing your focus, so that you can strategize a plan of action… all before even watching a minute of video!
- Any one of the collected data points would also be perfect for benchmarking your design, serving as the foundation to pave the way for improved user experience.
- UX Diagnostics is a quantitative line of defense that you can use to demonstrate to even the most skeptical of stakeholders that your ideas are valid and grounded in solid UX data.
UX Sprinting to successful user experiences
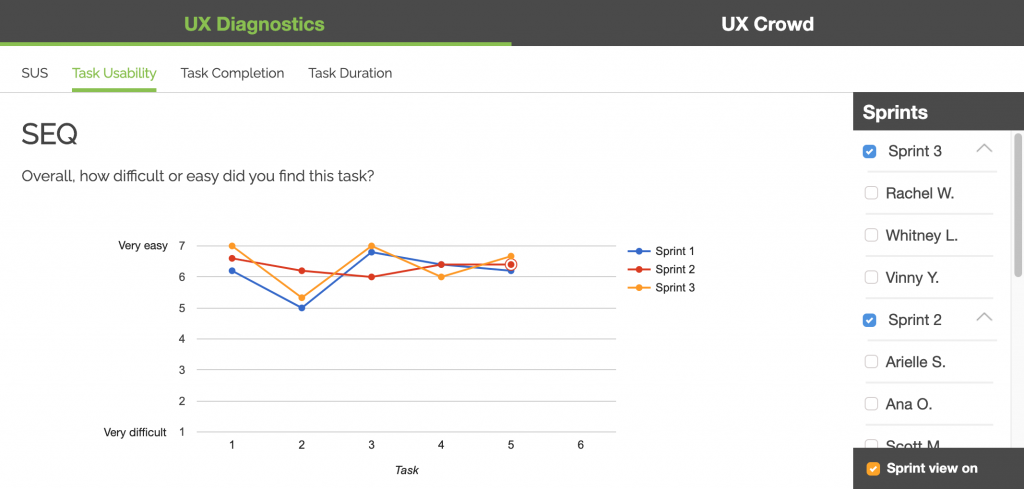
The importance of iterative testing in quantitative UX research and user testing cannot be overstated. There will never be a perfect design, but that doesn’t mean you shouldn’t be striving for near-perfection. UX Sprint enables you to do iterative usability testing that supports and builds on your design process to measure the impact of your work and point the way forward.
You can run new “sprints” of your usability tests, passing the same set of tasks to a new batch of testers to perform, and then view direct metric comparisons between new and old tester results to see how the usability of your designs has changed.
Read more: UX Sprint: Iterative testing to sculpt the perfect UX
Quantitating the qualitative: The UX Crowd
The UX Crowd is perhaps the most exciting tool TryMyUI offers researchers and designers. This time-saving quality of life feature unique to TryMyUI is a crowdsourced solution that helps you plan and prioritize your product roadmap with scaled-up insights from large tester pools. Really, this is the perfect feature for some quick A/B testing, whether for websites, mobile apps, and for people less experienced with UX research, like small businesses!
How’s it work? Using a weighted voting system, testers first share their opinions on the best and worst parts of the product, creating a sorted diagnosis list that clarifies at a glance what areas of opportunity exist. This is a handy way to quickly quantify qualitative data without wading through countless video minutes.
For example, in the above picture, 14 people voted that the icons “didn’t make any sense.” Had it just been a couple of people who felt that, it could have been easily dismissed as a matter of taste… but 14 agreed with the sentiment, validating it as an area of opportunity.
The UXCrowd makes user testing scalable – even if you run 50 tests, you’ll get every bit of insight out of them without having to watch a thousand minutes of video. It also liberates the challenge of prioritizing product problems from personal biases, allowing an objective vote-count to point the way.
Understanding the Industry: A/B Testing vs Usability Testing… what’s the difference?
UXspresso and other success stories with TryMyUI
Those familiar with our blog will know that we sometimes share our customers’ success stories in our UXspresso series.
Notably, National Geographic learned the importance of taking criticism and never dismissing user comments. They didn’t take it personally, and instead channeled even the harshest comments from testers into improvements to their UI.
With Spiralyze, we saw the universal problem most UXers (and professionals in any field) will inevitably face: your experts have forgotten what is common knowledge. Sometimes, the benefits of knowledge will render designs totally alienating, but by keeping it simple, concise, and researching what users know, Spiralyze rebounded beautifully.
While working with Deckchair, they uncovered something that has long been cautioned but is still regularly ignored: you are not the user! Deckchair helped one of their clients increase revenue by 147% via usability testing with TryMyUI. Their smoking gun? Video evidence. Showing stakeholders actual footage of user thoughts will always make the case in a personal way that data doesn’t.
Sometimes, our clients are so happy with the usability improvements and user experience insights that TryMyUI yields, they proactively tell the world. Read about Cake & Arrow’s love of our “robust quantitative data” and intuitive UI.
Perhaps one of our proudest achievements, the Canadian Revenue Agency utilized TryMyUI to test their COVID-19 relief portal, proving the potential UX has for positive impact on the world.
Don’t forget to compliment your design efforts with some these non-testing user experience software options, all recommended for limited budgets!
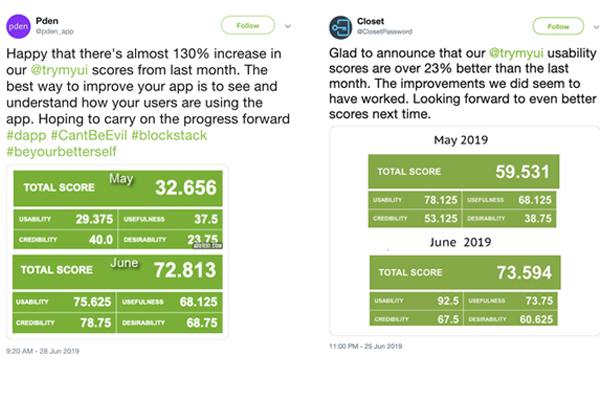
Interested in some recent before and afters? #GLOux
Read more: TryMyUI Reviews and Testimonials
UX research and usability testing with TryMyUI
Maybe you still aren’t convinced of TryMyUI’s quantitative UX research and user testing capabilities, or maybe you even think it’s so robust that it could never be affordable. Please try our free trial or schedule a demo with us so we can show you exactly what we can do for you. There’s no harm in just taking a look.
We won’t tell your other usability testing platform.