Looking for an alternative to Google Analytics? If you are, Trymata’s Product Analytics suite offers many of the same benefits, but with data and capabilities that go much further to help you really understand what visitors are doing on your website.
To quickly summarize, Trymata Product Analytics is like a combination of all the website usage data from Google Analytics, with all the behavioral analytics of tools like Hotjar or Fullstory.
In a single platform, we enable you to cross-reference macro- and micro-level user insights. You’re able to get big-picture metrics on the performance of key webpages and flows (pageviews, bounce rates, navigation, etc.), and then dive deep into the sessions of specific, relevant users to understand the why behind those metrics.
If you’ve struggled to learn how to use Google Analytics, or you’re worried about losing key metrics and data with the upcoming switch to Google Analytics 4, Trymata Product Analytics is the alternative you’ve been looking for!
Comparison: Web analytics data from Google Analytics & Trymata
Trymata Product Analytics offers many of the same web analytics datasets as Google Analytics, with a few more as well.
Below, we’ll run through the main types of data that Google Analytics provides, and how Trymata stacks up.

Audience data
The “Audience” section of Google Analytics provides a variety of datasets about who is visiting your website. This includes factors related to:
- Geography (what countries & cities they are in)
- Technology (what devices & platforms they are on)
- Previous interaction with your site (whether they are new or returning visitors)
Trymata Product Analytics offers all of these same data points and more. Our visitor demographics & technology sections will show you your web visitors’…
- Country, state, city, and continent
- Device type, model, brand, and resolution
- Operating system, browser, and most common combinations of them
We also have an entire section dedicated to data on visitors’ history with your site, allowing you to view:
- Visits by day of the week
- Visits by hour of the day (in visitors’ local time)
- Visitors by their number of total all-time visits
- Visitors by number of days since their most recent prior visit
…and more. General overview data about new and returning visitors is also available, and when viewing session logs and information about specific individual users, we’ll show you whether they’re new or returning, and other relevant historical data.
Acquisition data
The “Acquisition” section of Google Analytics provides data about how visitors are coming to your website.
At the highest level, traffic is grouped by visitors who arrived from organic searches, social media, referrals by other websites, paid ads, or specific campaigns you’re running. Additional data is available for each of these different groupings.
Trymata Product Analytics provides the same key acquisition datasets, showing you the channel types and sources that users arrived from, and the more advanced information on referrers, organic search, social media, campaign clicks, and more.
Trymata also has a built-in tool for creating your own campaign tracking links, so you can easily start running new campaigns and seeing the performance data.

Behavior data
The “Behavior” section of Google Analytics provides different sets of data about what people are doing while they’re on your website.
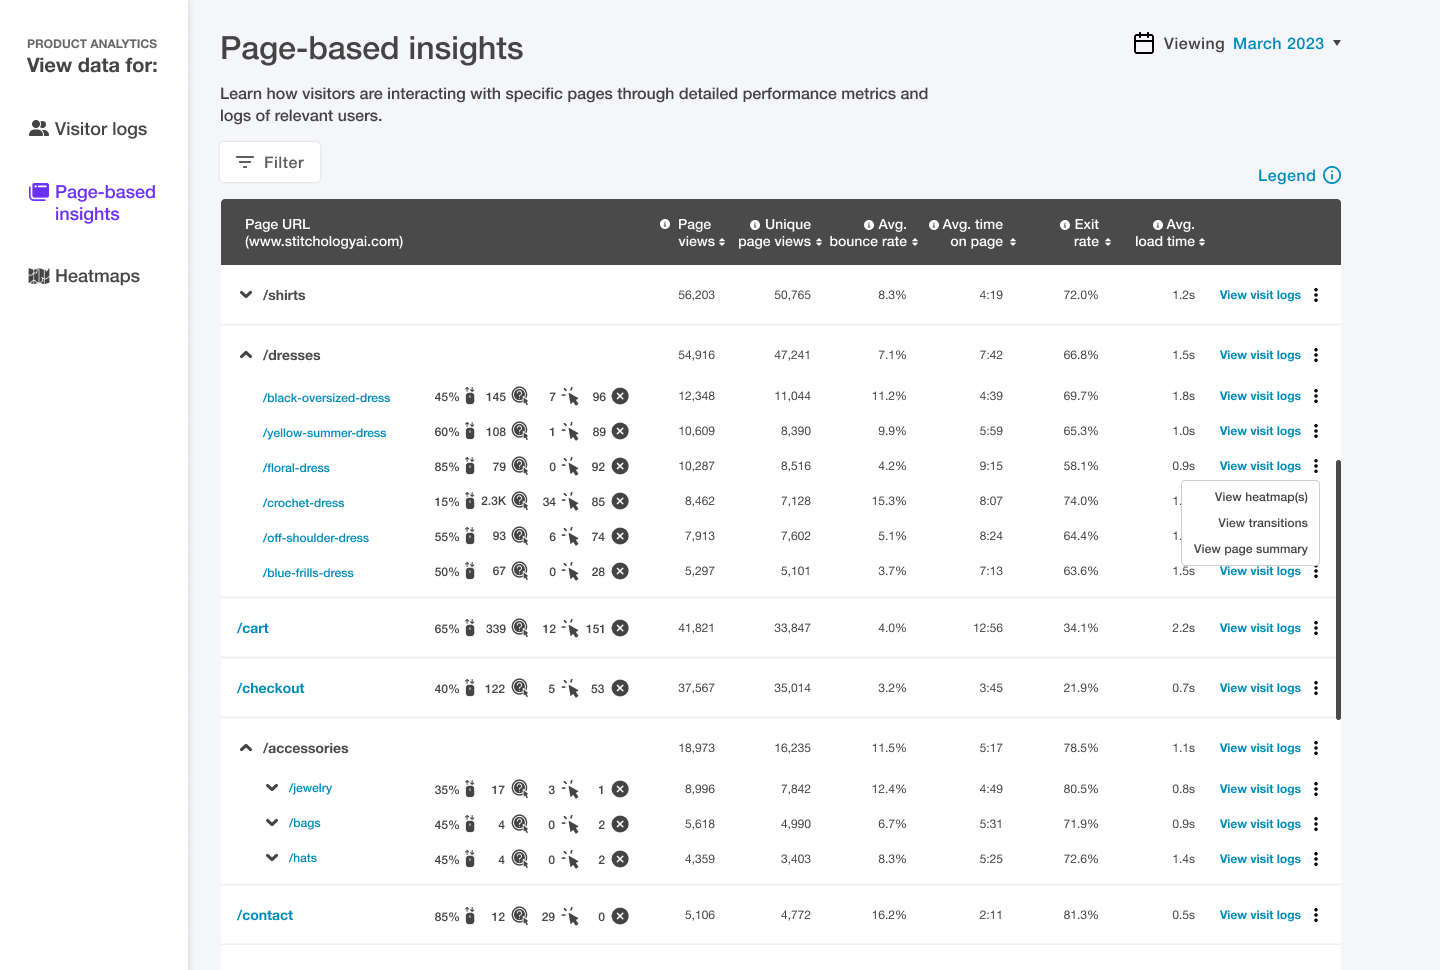
Primarily, this comprises metrics for all of your webpages: which ones have the most views, how long people spend on each page, bounce rates and exit rates per page, which pages sessions start on, and more.
This is also where you’ll find data for any “events” you’ve set up, and for visitor usage of your site search function if you have one.
Not only does Trymata offer all of this data, we offer it in a format that’s easier to understand and analyze than Google Analytics. When viewing your webpage metrics, pages in the same branch/directory of your website are automatically grouped together.
For example, if your site has a bunch of product pages for different dresses, all following the format /dresses/product-name (such as “/dresses/yellow-summer-dress” and “/dresses/floral-dress”), all of those “/dresses/…” pages will be shown together for easy comparison.
In addition to all of this, Trymata offers advanced data on user flows and funnels, most common pathways, and navigational patterns. If you’re not sure what your website’s “user journey” is, our platform will show you!
Conversions data
The “Conversion” section of Google Analytics is where you can set up and track goals for your website.
Goals can be any action you want users to take on your website: visiting a page, viewing or clicking on an element, purchasing an item. Once you’ve created your goal metric, this section of Google Analytics shows you how many users have met that goal over time.
Currently, Trymata Product Analytics is not yet offering a goal-tracking feature, but it’s already on the way. When this feature is released, you’ll be able to set up any goal that you would be able to set up on Google Analytics, and collect more advanced and complete data around its performance.
Changes coming with Google Analytics version 4
As you probably already know, Google Analytics is forcing all users to switch from their familiar version 3 model (“Universal Analytics”) to a totally changed version 4. (In fact, that switch might be the reason you’re here looking for an alternative to Google Analytics!)
GA-4 will do away with many of the default datasets, views, and tables we’ve all grown accustomed to using on version 3 (including entry and exit pages, campaign data, page navigation data, and others).
While some basic metrics will stay the same, many will become much harder to track. It’s likely that some of the KPIs you’ve been tracking will be buried several layers deeper in the new Google Analytics version, and may require difficult setup steps to access.
Read more: What to expect from Google Analytics 4
If you are used to Google Analytics 3 (“Universal Analytics”), and are hoping to continue tracking your same website metrics after the forced switch to GA-4, Trymata Product Analytics is the best alternative. You’ll have access to almost all of the same datasets, right at your fingertips – plus a whole lot more.
Talk to our team about getting Trymata data & insights for your website!
Trymata data & features that are different from Google Analytics
While Trymata Product Analytics provides all the same web analytics data you’re used to from Google Analytics, we don’t stop there.
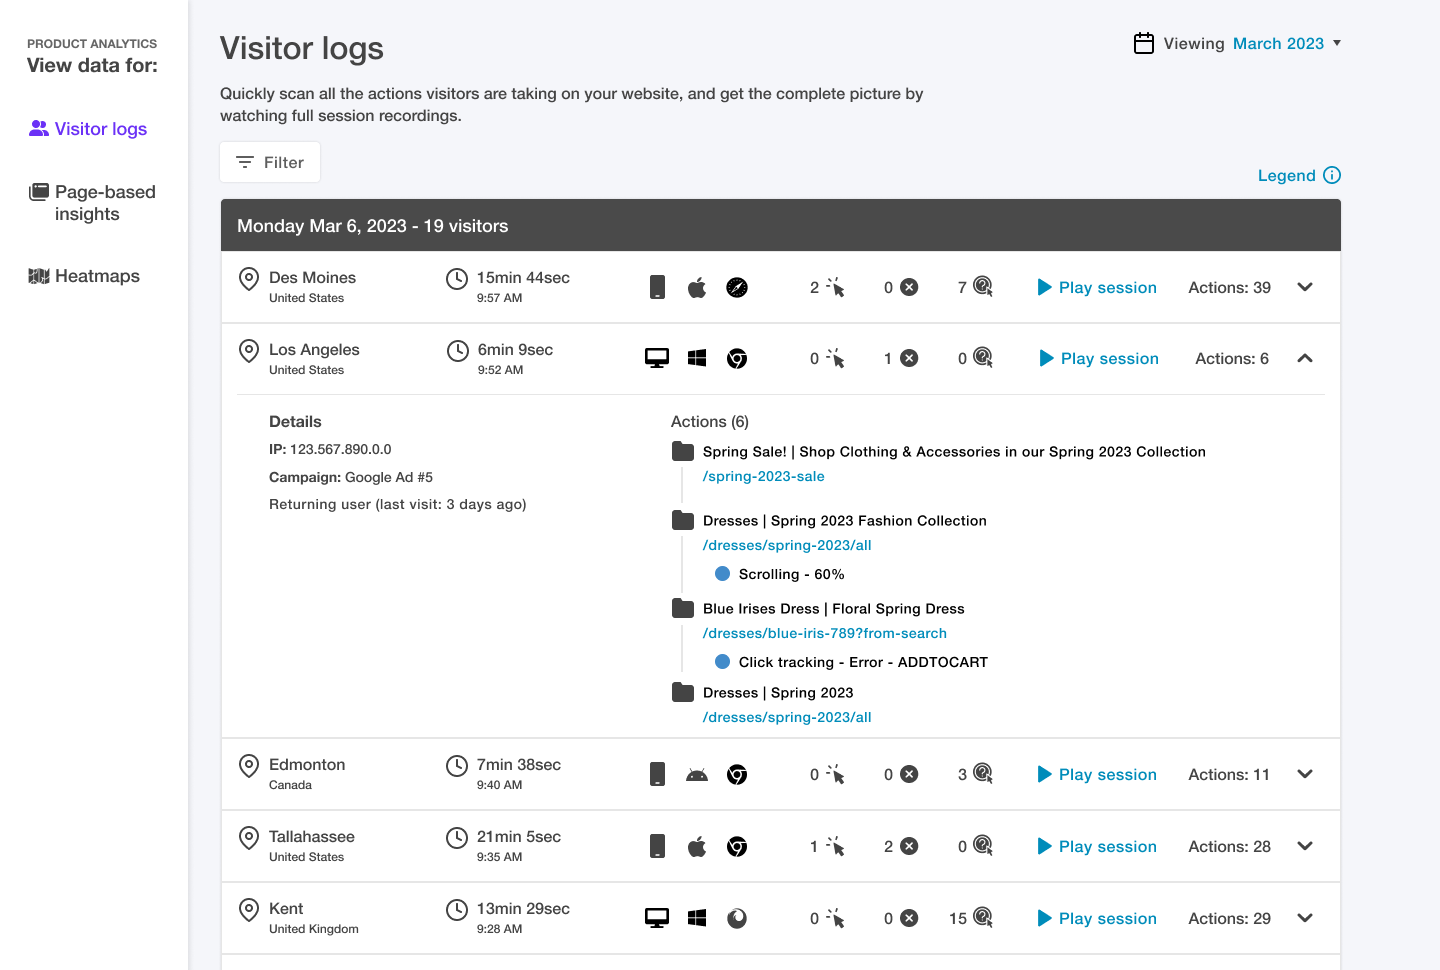
In addition to all of this big-picture information about your website, webpages, and visitors, we also give you an enormous amount of small-scale human insights data. Precise logs of what each visitor is doing and where they’re going on your website, with frustration indicators and session replay videos, allow you to get up close and personal (in an anonymized, privacy-friendly way) with your users.
On Trymata, all the behavioral data of a platform like Hotjar or Fullstory is combined and integrated with the big-picture web analytics data. With this powerful combination, you can do smart, targeted, efficient research that gets to the heart of your website usage trends and reveals opportunities for optimization and growth.

Some of the human insights data that you’ll get with Trymata Product Analytics includes:
- Website visitor logs: Access a sortable library of every website session, and skim through action logs to see the paths that each user took, and where they ran into difficulties.
- Session replay videos: See your visitor logs come to life by watching reconstructed session playback videos. Get an intimate view of how real people are experiencing your site.
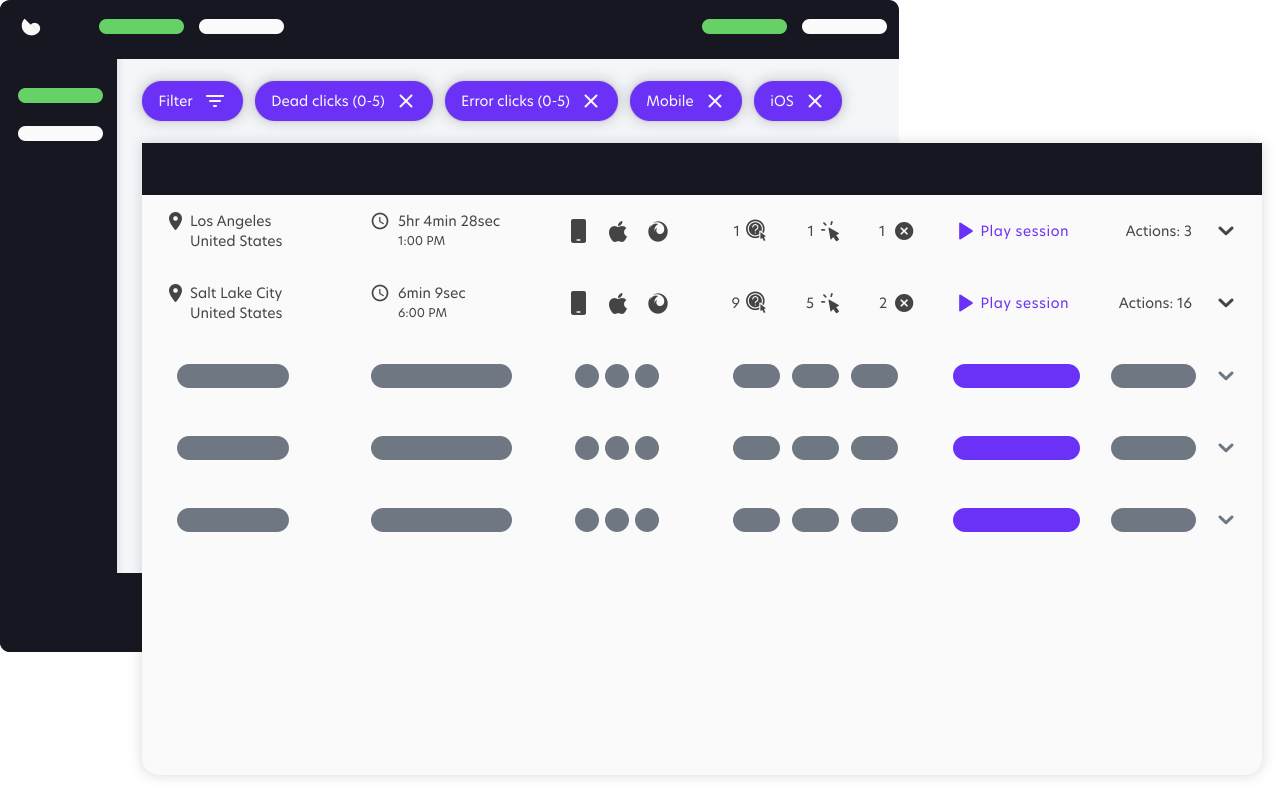
- Frustration indicators: Instantly identify visitors whose sessions were plagued by moments of frustration, like rage clicks and error clicks.
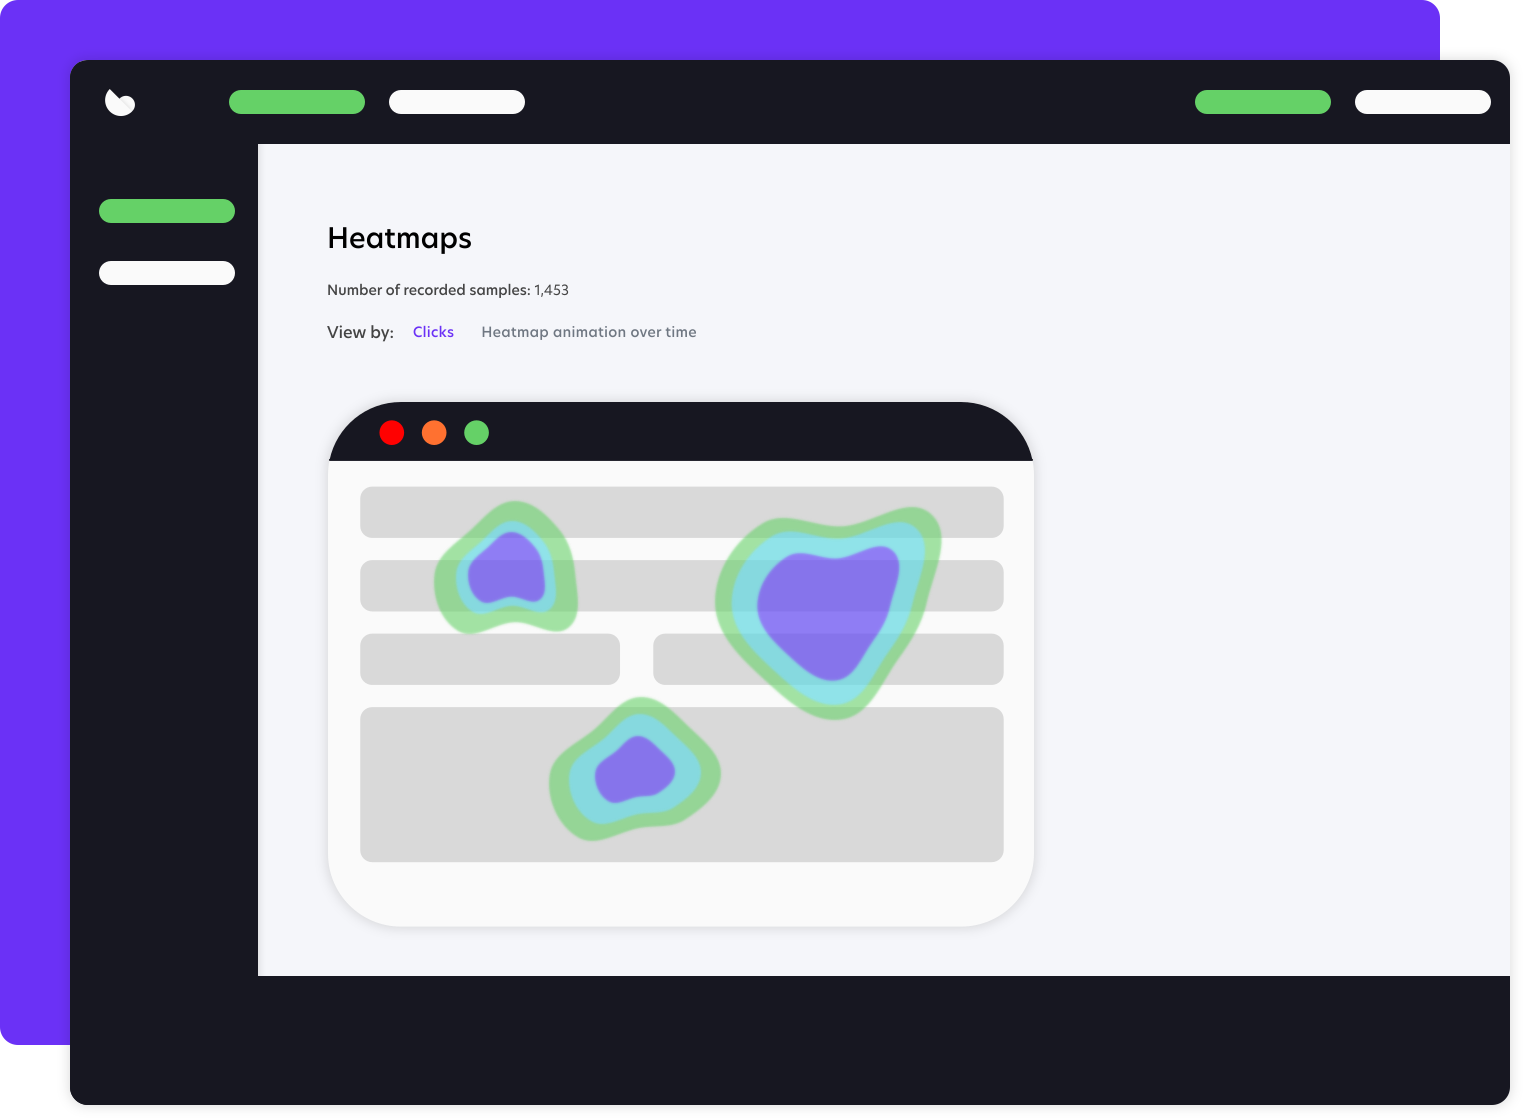
- Heatmaps: Set up heatmaps for any page on your website and collect data over time to uncover the common ways people are interacting with those pages.
All of these features are powerful on their own, but the real value is the way that they combine with your website data. Your visitor logs are not just available as a giant library of every session – for every dataset you view on Trymata Product Analytics, you can also see the associated visitor logs for just that data point.
For example, if you’re looking at your page performance data, and you’re curious about how visitors are interacting with one specific page, or with a specific grouping of pages – you can pull up the visitor logs of everyone who visited those exact pages. If you want to understand the experience of visitors arriving on your site from Facebook, or on Android phones with a Chrome browser – you can pull up the visitor logs for just those subsets.
This feature enables you to seamlessly jump back and forth between the large-scale and small-scale, the overarching patterns and the individual human moments that make them up. On their own, neither side of that equation really explains the user experience on your website; but together, they unlock enormous potential for optimizing your digital presence.

Switch to the best Google Analytics alternative
Between the exhaustive web analytics data, advanced behavioral insights data, and the easy way they are served up to empower your research, Trymata Product Analytics is the obvious choice for those looking to transition off of Google Analytics.
That’s not even taking into consideration Trymata’s usability testing suite, which can truly take your user insights practice to the next level! (Our product suites can be purchased and used separately, so if you’re not looking to do user testing right now, don’t worry – we don’t force any tools or add-ons on you.)
If you’d like to learn more about getting started with Trymata, you can book a call with our sales team or kick off a free 2-week trial below.
Take the first step to a more effective web presence!


