


The System Usability Scale (SUS) is a standardized psychometric survey for measuring the usability of a website or other interactive system. Long a favorite among UX researchers for its simplicity and accuracy, SUS is a valuable quantitative tool for anyone trying to optimize their website’s user experience.
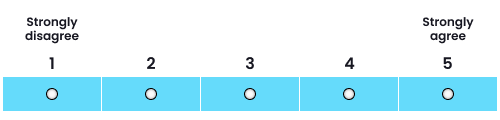
SUS consists of a short, 10-item questionnaire administered at the end of a usability testing session. Users respond to each question on a 5-point scale, from “Strongly disagree” to “Strongly agree.” These answers are then used to calculate an extremely reliable overall usability score for your website.
The System Usability Scale (SUS) questionnaire
The questionnaire for calculating a website’s SUS score consists of the following 10 items:
- I think that I would like to use this system frequently.
- I found the system unnecessarily complex.
- I thought the system was easy to use.
- I think that I would need the support of a technical person to be able to use this system.
- I found the various functions in this system were well integrated.
- I thought there was too much inconsistency in this system.
- I would imagine that most people would learn to use this system very quickly.
- I found the system very cumbersome to use.
- I felt very confident using the system.
- I needed to learn a lot of things before I could get going with this system.
For each question, users evaluate how much they agree or disagree with the statement, based on their experience using the website or app during their test session. They then mark their answers on a 5-point Likert scale similar to the one shown below.
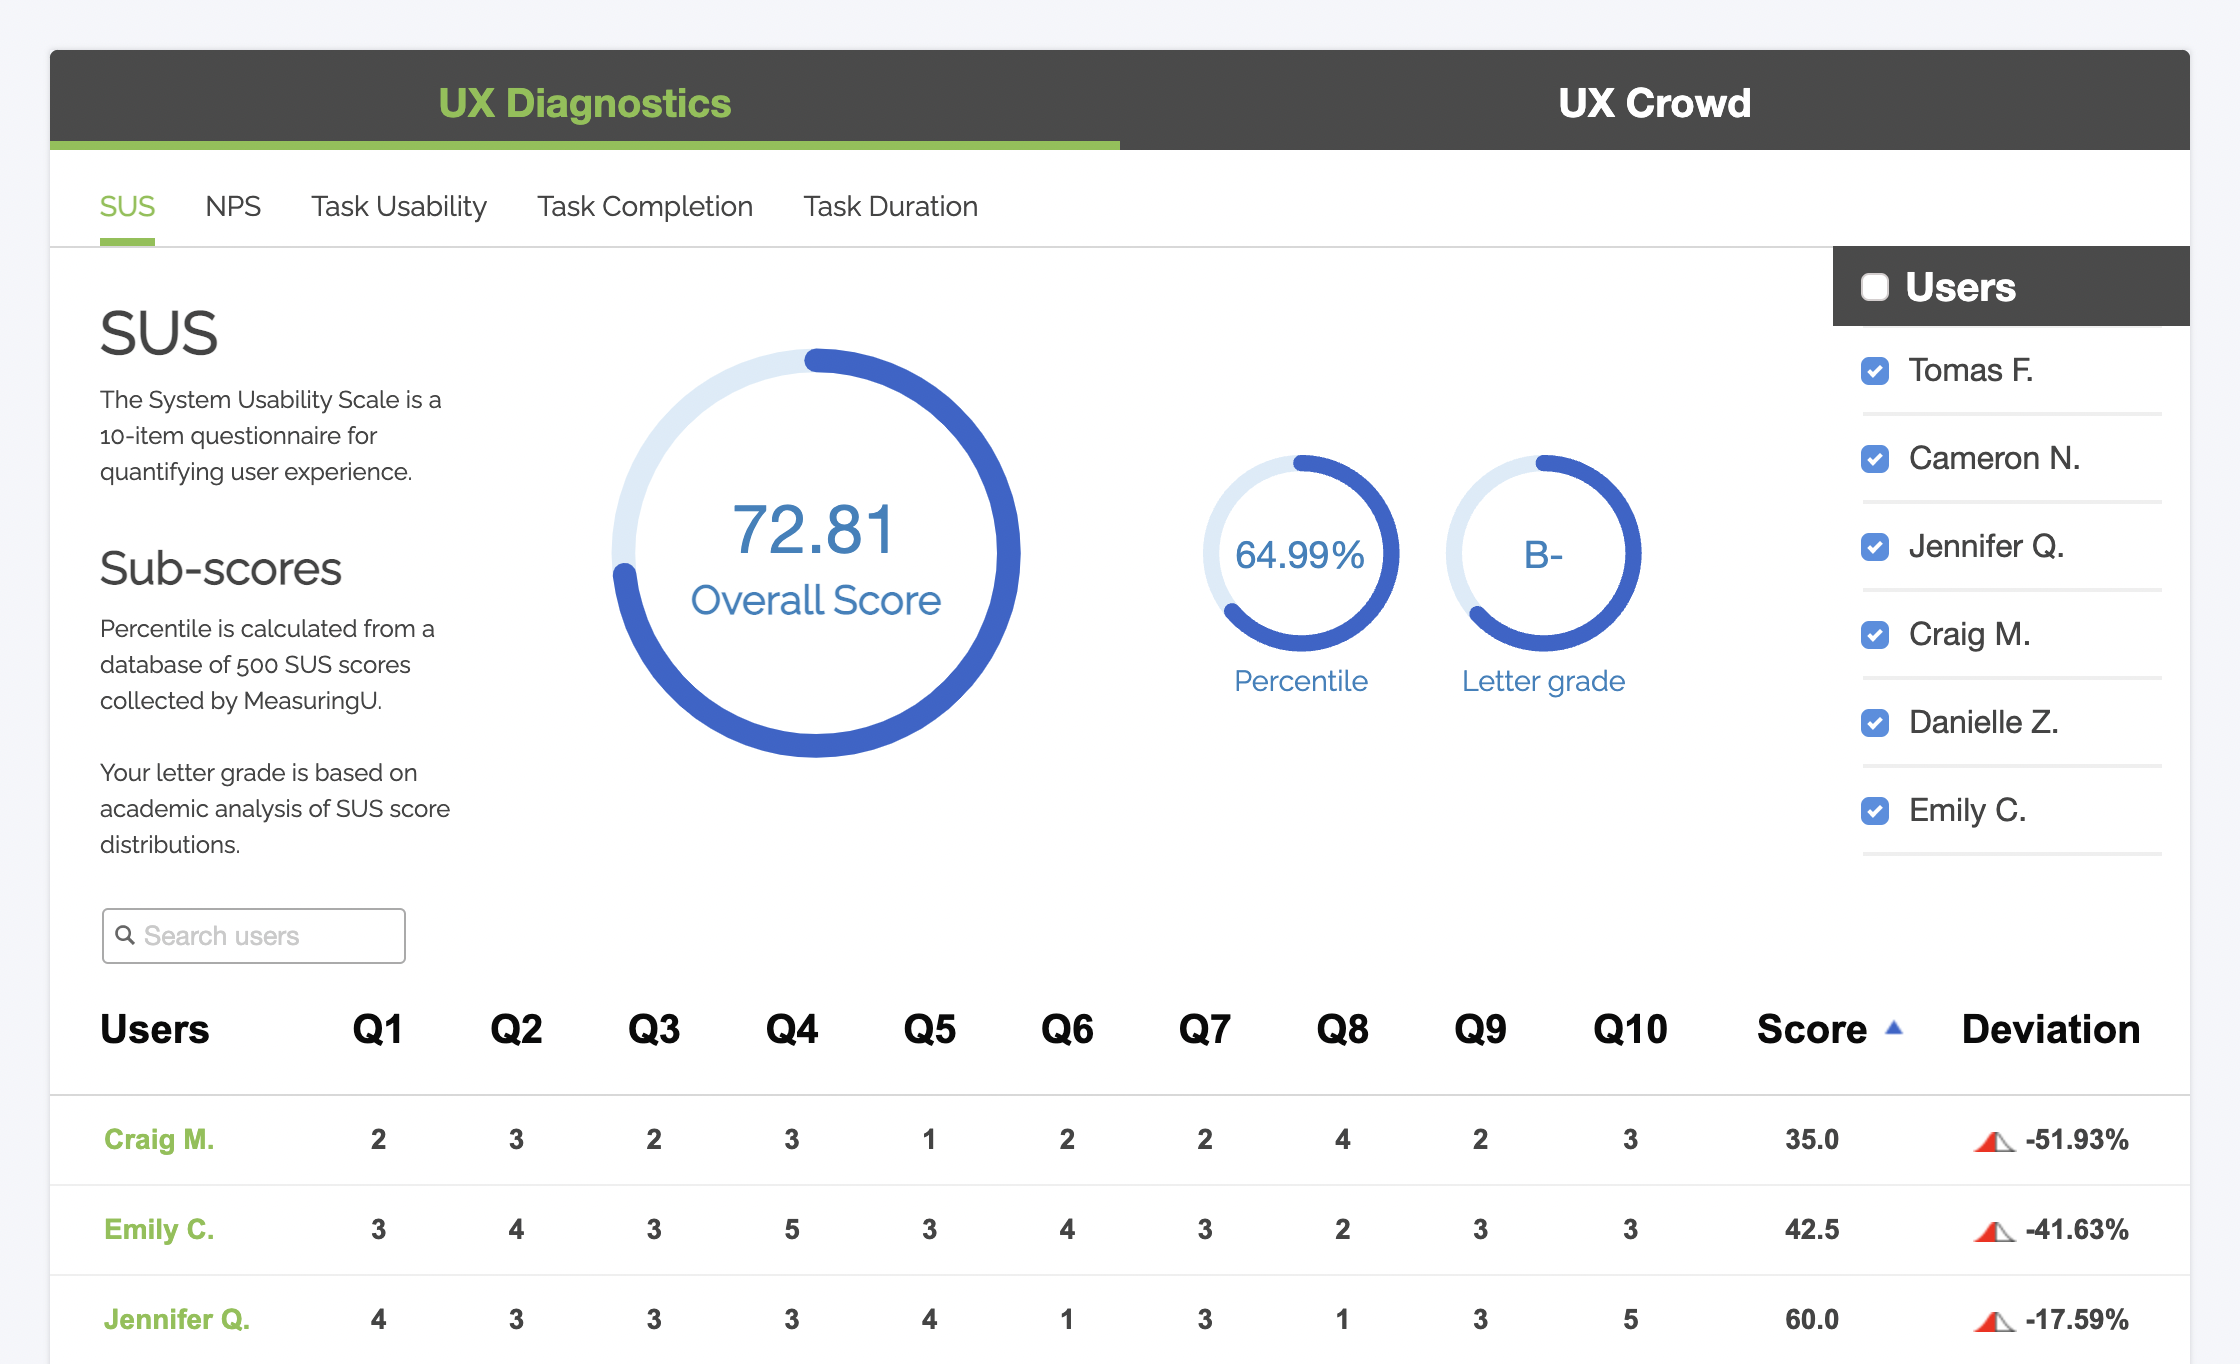
Interpreting your System Usability Scale results
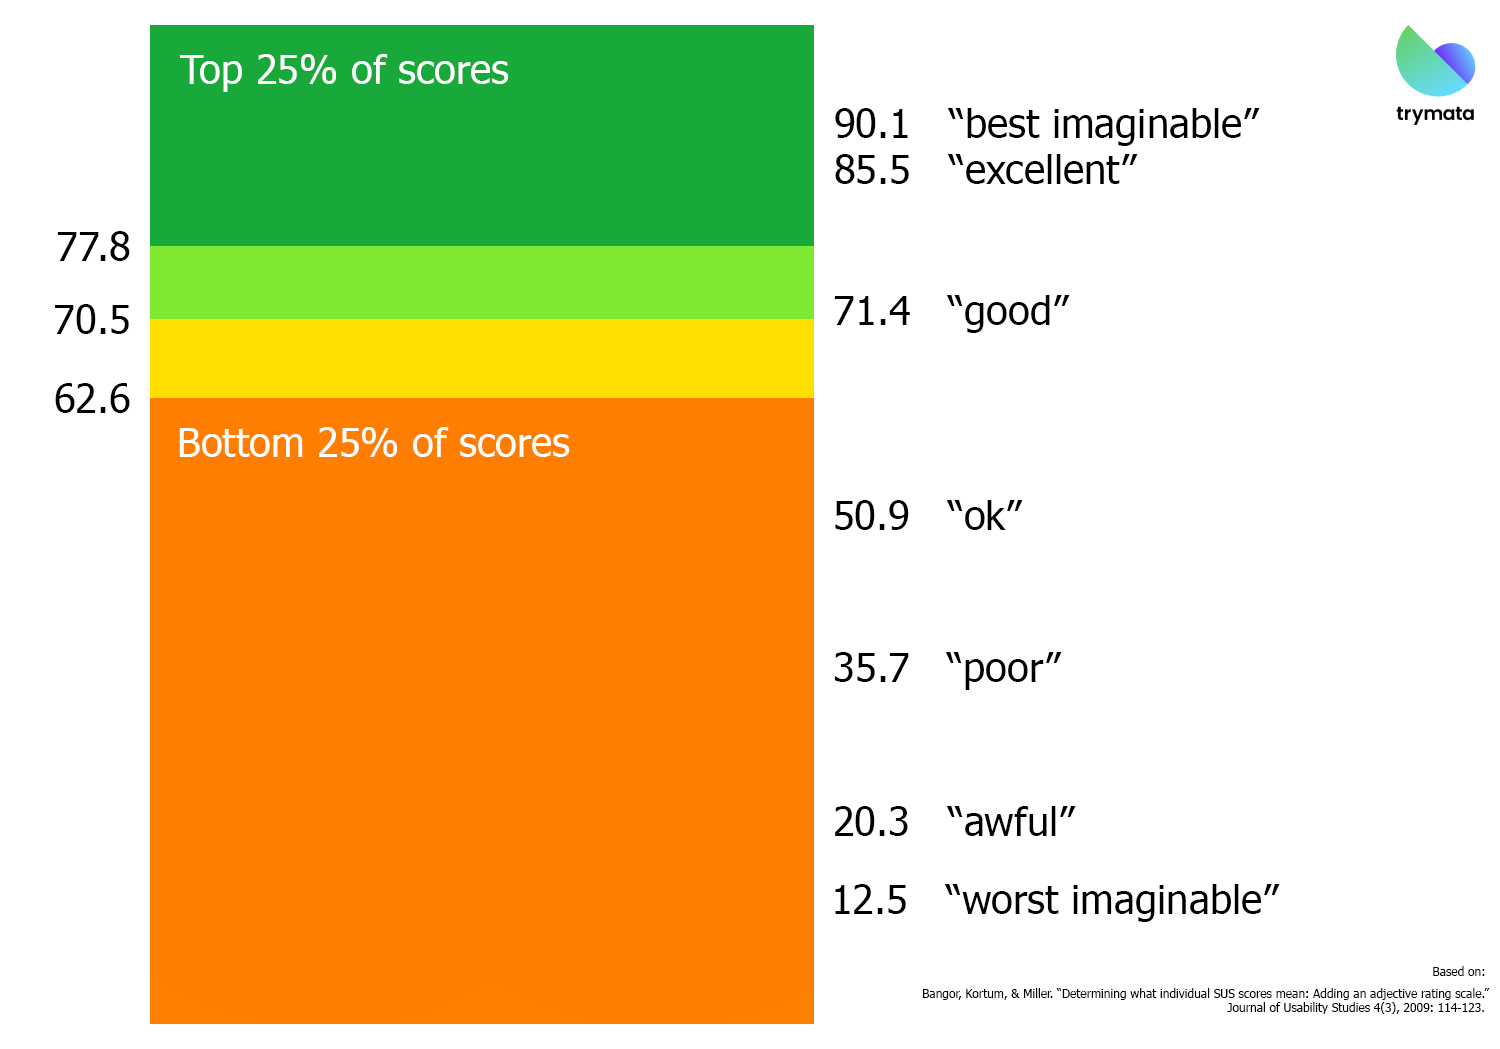
Based on different studies, the mean (average) SUS score is around 68-70.5. If your score falls close to this range, you can assume that your website’s usability is about average.
Some quantitative UX researchers have attempted to map adjectives like “excellent,” “poor,” or “worst imaginable” to different scores for an additional level of insight. For example, a 71.4 (just above average) corresponds to “good”: better than an “ok” 50.9 score, but falling short of an “excellent” 85.5.
SUS percentile rankings
Another way to add meaning to your SUS score is to turn it into a percentile ranking. By comparing your results against hundreds or thousands of scores collected in other user testing studies, you can contextualize your site’s performance relative to the rest of the web. So for example, an average score of 70.5 is in the 50th percentile (better than half of the sites tested) according to our database of 500 websites.
Read more: Comparative usability testing studies
Though described by its inventor as a “quick and dirty” measure, studies have found SUS to be among the most accurate and reliable of all usability surveys, across sample sizes. It is now one of the most popular metrics for quantifying system satisfaction, with thousands using it to gauge user-friendliness over a wide range of products online and off, especially for ecommerce UX.
The System Usability Scale is also a great tool to use in tandem with A/B testing, for both websites and mobile apps! By collecting SUS scores for each of the websites or interfaces being tested, you can directly compare the performance of each one with a reliable metric.
All these qualities make SUS a valuable tool for standardizing a diverse mix of tester feedback, and aggregating responses into a meaningful, but concise, picture of your UX. If individual test videos are the trees, SUS shows you not only the forest, but the entire ecosystem. With a widely-trusted industry standard to rely on, you can take a step back from your own company and see how you chalk up in the broader world around you.
Get free SUS scores for your website or app today:

How does SUS differ from other psychometric models?
The SUS is the absolute baseline psychometric for quantifying the user experience. Virtually every other usability testing psychometric model was either directly inspired by, or influenced by, the System Usability Scale.
This means that SUS is the least specialized out of all other psychometric survey options. It was designed to be able to measure experiences for any interactive tool, platform, software, or hardware. While it is quite reliable and works well for website usability tests, it wasn’t created specially for that purpose like some others.
Below is a list of all of the built-in psychometric models available on the Trymata user testing platform, and why they might be a good alternative to the System Usability Scale, depending on your situation.
PSSUQ
The PSSUQ and the SUS are fairly similar, widely-utilized psychometrics that have been around for decades. The key difference between the two is the specificity of purpose. While SUS is a generalized, overall satisfaction metric, PSSUQ was specifically designed to be used at the end of a scenario-based usability test. Thus, the questions are worded much more precisely to apply to user experiences on digital products.
The PSSUQ also has a 3-vector breakdown, providing sub-scores reflecting your product’s system usefulness, information quality, and interface quality. This extra degree of nuance can be handy for identifying the specific areas where your designs could use more work.
On the other hand, to accomplish this additional nuance the PSSUQ is a longer and more complex survey – 16 questions, with a 7-point response scale. If your user test is already long and/or complex, the PSSUQ may contribute to tester fatigue, and you could end up with lower-quality final data.
Take a look at our in-depth comparison: SUS vs PSSUQ: Quantifying user experiences
ALFQ
The Adoption Likelihood Factor Questionnaire is meant for early-stage development products, or to gauge users’ general interest in a new product. While ALFQ does measure some aspects of usability, it isn’t for sophisticated usability and usefulness research in the way that SUS or PSSUQ is. Instead, its goal is to capture users’ attitudes and interest towards a product they’ve been newly exposed to for the first time.
SUPR-Q
Jeff Sauro’s Standardized User Experience Percentile Rank Questionnaire (SUPR-Q) measures more than just usability or satisfaction, tapping into the heart of the user’s more holistic thoughts on a product, such as trust and credibility as well. One notable consideration here is the brand context: SUPR-Q is best utilized for established companies that users are familiar with (though it certainly doesn’t have to be). There’s also a special ecommerce version of the SUPR-Q, so it’s a great fit for ecommerce UX testing.
SRS
The Survey Respondent Scale (SRS) is the brainchild of a partnership between Trymata, MeasuringU, and QuestionPro to address the problem of cognitive stress and fatigue for respondents filling out surveys. This model quantifies how user-friendly a survey is, based on data from test respondents. SRS is an extremely specialized metric that is meant more for marketing research than UX/design teams.
Your first 5 user testing results with Trymata are FREE! Start now:
For more info about applying the System Usability Scale with your usability testing program, the video below contains great insights from our webinar with quantitative UX expert Jeff Sauro.